
A Simplified Approach for Modeling Urban Growth in Siguiri-Centre, Guinea
-
Moriken Camara


Department of Environment, Faculty of Forestry and Environment, Universiti Putra Malaysia, Serdang, Selangor, Malaysia
| Received 07 Oct, 2025 |
Accepted 10 Dec, 2025 |
Published 11 Dec, 2025 |
Background and Objective: Rapid urbanization is transforming West African landscapes, yet few studies have quantitatively assessed its spatial dynamics at the local scale. This study analyzes and models urban growth in Siguiri-Centre, Guinea, using multi-temporal Landsat imagery (1990-2020) and spatial modeling. The objective is to forecast future urban expansion by 2030 using a compact-growth framework suitable for data-scarce contexts. Materials and Methods: Landsat imagery from 1990, 2000, 2010, and 2020 was processed in Google Earth Engine for -use classification. Urban and non-urban areas were extracted and analyzed in R and ArcGIS Pro. Temporal models (linear, exponential, and compound annual growth rate) were used to project urban extent to 2030. Spatial allocation was guided by proximity-based suitability and neighborhood contiguity metrics to promote compact growth. Results: Findings indicate a fivefold increase in urban land from 1990 to 2020, primarily driven by mining and population growth. The linear trend model predicted ~170 km2 of urban area by 2030. Spatial simulations revealed that growth is likely to occur contiguously along existing urban edges, reinforcing a compact development pattern. Conclusion: The results highlight the importance of proximity-driven expansion models for realistic urban forecasts in developing regions. Integrating such models into planning frameworks can help balance urban development with sustainable land management.
INTRODUCTION
Urbanization is one of the most significant global land-use changes of the 21st century, with profound implications for environmental sustainability, resource management, and human well-being. In developing regions, rapid urban growth often occurs in contexts of limited planning and weak institutional capacity, amplifying the risks of land degradation, infrastructure deficits, and environmental stress1. West Africa is experiencing particularly rapid urban expansion, driven by population growth, resource-based economies, and migration dynamics. As recent empirical research emphasizes, rapid urban expansion in developing regions is frequently associated with declining urban densities, resulting in increasingly land-intensive urban forms that place pressure on ecosystems and elevate infrastructure and service delivery costs1,2. Guinea illustrates these dynamics intensely. In the Kankan Region, the prefecture of Siguiri has emerged as a major center of mining and population growth. The commune of Siguiri-Centre, the administrative seat of the prefecture, has undergone a rapid population increase and a visible outward expansion of its built environment, mirroring the strong urbanization dynamics documented for Guinea and West Africa’s secondary cities3,4.
This transformation raises critical questions about how the urban footprint of Siguiri-Centre is evolving, what patterns of spatial growth are emerging, and what the implications are for sustainable land use and planning.
Understanding these questions requires reliable methods to quantify urban expansion and forecast future growth trajectories. Land-use and land-cover (LULC) mapping, combined with spatial modeling, has become a basis of urban growth analysis. Remote sensing approaches allow consistent monitoring of land change over time, while spatial models provide tools to simulate future growth based on observed trends and suitability drivers5. In particular, compact growth modeling frameworks, which allocate expansion near existing urban areas, have gained prominence for their ability to reflect observed contiguity in city growth patterns and to inform strategies for sustainable expansion6.
This study applies a remote sensing and spatial modeling framework to assess past and projected urban growth in Siguiri-Centre. Using Landsat-derived LULC maps from 2000, 2010, and 2020, we quantified historical expansion, fit temporal growth models to estimate the 2030 urban extent, and simulated the spatial allocation of new urban land based on proximity-based suitability and contiguity criteria. By situating Siguiri-Centre within the broader literature on global urban expansion1,7. This study contributes both an empirical case of rapid urban change in West Africa and a methodological demonstration of how simple, robust modeling frameworks can support foresight in data-scarce contexts. The results provide insights into the pace, form, and sustainability of Siguiri’s urbanization, with implications for land management and future urban planning.
MATERIALS AND METHODS
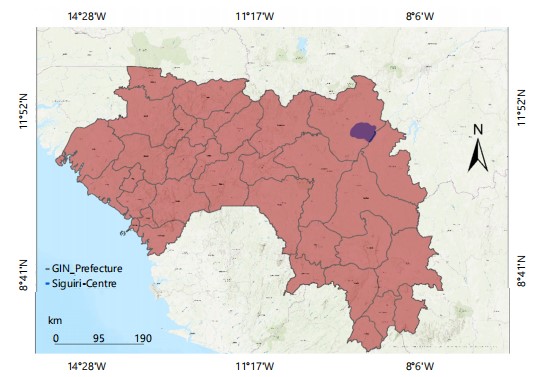
Study area: Siguiri-Centre is the urban commune and the central subdivision serving as the administrative seat (chef-lieu) of Siguiri Prefecture, in the Kankan Region of Guinea (Fig. 1). This study covers a thirty-year period from January, 1990 to December, 2020, with projections extending to January, 2030. The prefecture of Siguiri is subdivided into multiple sub-prefectures, of which Siguiri-Centre is one (the urban core). The prefecture covers a large area of around 18,500 km2 and borders Mali to the north, as well as neighboring prefectures such as Kankan, Kouroussa, and Mandiana. The region is well known for gold mining activity in the area of Siguiri, agriculture along river valleys (e.g., Niger, Tinkisso), and its rural surroundings. According to the National Institute of Statistics of Guinea, Siguiri-Centre had a population of 183,875 in 2014, covering an area of 928.0 km2 with a population density of 198.1 inhabitants per km2. Between 1996 and 2014, the population grew at an average annual rate of 7.3%.
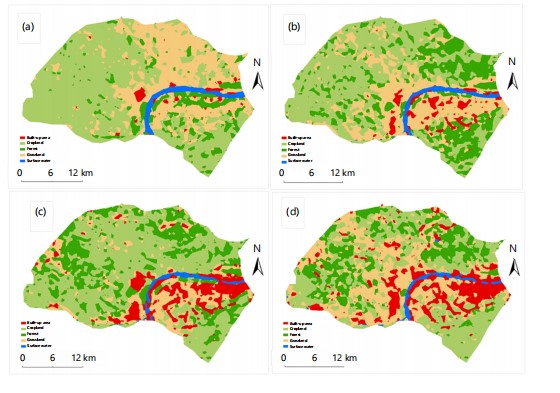
Land use mapping and urban growth modelling: This study employed Google Earth Engine (GEE) to generate land-use/land-cover (LULC) maps for Siguiri-Centre in Guinea (Landsat 7 TOA for 2000, Landsat 5 TOA for 2010, and Landsat 8 TOA for 2020). During image pre-processing, median composites were created and appropriate spectral bands, such as Red, Near-Infrared (NIR), and Short-Wave Infrared (SWIR1), were selected. Landsat 5 SR data were scaled to surface reflectance. Using the K-Means clustering algorithm (Unsupervised Classification), 5 land-cover clusters were generated from 5,000 random samples of the selected bands. The classified images were clipped to the AOI and exported as GeoTIFF files (30 m resolution) to Google Drive (Fig. 2). The output provides five integer classes representing the major land-cover types for each target year.
|
|
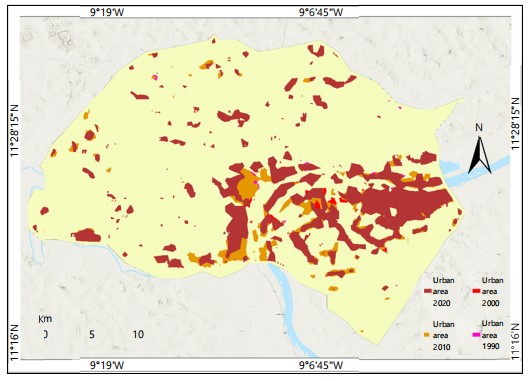
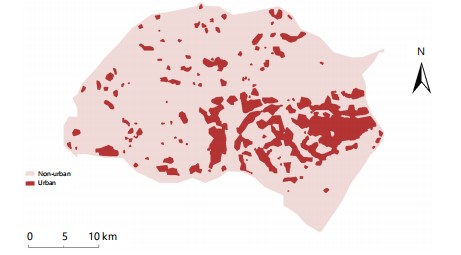
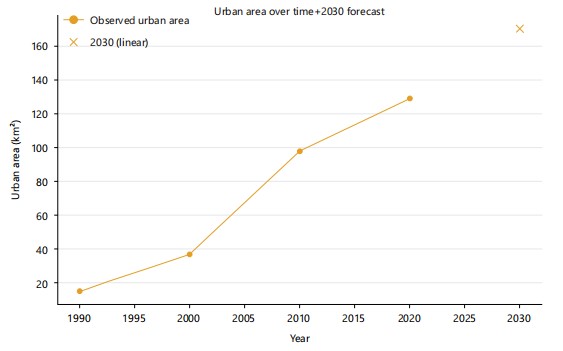
The analysis, in R Studio and ArcGIS Pro, used land-use polygon layers for Siguiri-Centre (years 2000, 2010, 2020), each containing the field of two classes, such as Urban and Non-Urban (Fig. 3). All layers were transformed to WGS84/UTM Zone 29N (EPSG:32629) to ensure metric distances and areas. The 2030 total urban area target was obtained by fitting simple temporal growth models (linear and exponential) to the observed 2000-2020 urban area; the linear model minimized AIC and provided the 2030 target area. This approach is grounded in model selection theory8.
|
The modelling followed a quantity location framework. The additional urban area required by 2030 was computed as the difference between the target and the 2020 extent, while the spatial allocation of this increase was guided by a suitability surface and a neighborhood contiguity term to encourage compact growth. Many peer-reviewed studies, such as those by Seto et al.1 and Venter et al.7 have similarly relied on binary urban footprints derived from land-use/cover data to quantify and analyze urban expansion.
The final suitability surface relies solely on proximity to existing 2020 urban areas. A Euclidean distance transform was computed from urban cells of the 2020 map, then min–max normalized and inverted so that near-urban pixels are favored:
where, D_U(x) is the straight-line distance from location x to the nearest 2020 urban pixel. Values close to 1 occur inside or adjacent to existing urban areas and values approach 0 at far distances.
Neighborhood contiguity was computed as the 3×3 focal mean of the 2020 urban raster to promote compact growth. Composite potential was defined as:
where, N(x) is the contiguity index and w_neigh its weight. The number of new cells (K) needed to reach the 2030 target was then selected by ranking eligible cells by P(x) and allocating the top K. The final 2030 map equals 2020 urban plus the allocated cells. This approach is well-documented in the literature5,6.
RESULTS AND DISCUSSION
Urban expansion trends (1990-2020): Figure 4 shows an increase in urban land in Siguiri-Centre from 1990 to 2020, with a corresponding decline in non-urban areas. The built-up surface expanded several-fold, reflecting rapid urbanization fueled by gold mining and rural-urban migration. Population growth averaged 7.3% annually between 1996 and 2014, and has clearly driven this land conversion. Similar trends have been observed across sub-Saharan Africa, where urban land expansion often exceeds population growth1. Despite this rapid change, Siguiri’s growth appears relatively important and contiguous.

|
|
New development is mainly clustered around existing centers, indicating a radial expansion pattern that remains adjacent to the established built environment. Compact, contiguous growth can be more sustainable, preserving agricultural and ecological land while improving infrastructure efficiency1. Nonetheless, continued outward growth threatens farmland and ecosystems, underscoring the need for integrated urban-environmental planning.
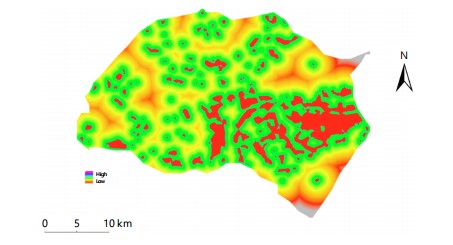
Urban change potential and suitability mapping: Figure 5 and 6 illustrate the simulated spatial distribution of future urban growth. The highest change potential occurs along the periphery of the urban boundary, reflecting the distance-based suitability surface and neighborhood contiguity weighting. This compact growth model, favoring adjacency to existing built-up areas, yields a contiguous ring of likely expansion. Such patterns align with GIS-based urban models emphasizing proximity to infrastructure as a key driver5,6.
The suitability gradient confirms that urban proximity is a dominant factor, with suitability values decreasing sharply with distance. While the model omits socio-economic and topographic variables, it provides a robust baseline: Assuming current trends, Siguiri’s urbanization will continue as outward, contiguous expansion rather than fragmented sprawl.

|
|
| Table 1: | Urban Area Projections for 2030 | |||
| Method | A2030 (km2) |
| Linear trend (2000, 2010, 2020) | 170.2818 |
| Exponential (log-linear fit) | 328.8625 |
| CAGR based on 2010 → 2020 | 169.7865 |
| Best estimate (linear trend) | 170.2818 |
Urban growth projections to 2030: Urban area projections for 2030 (Table 1) show that the linear trend model provides the most reasonable forecast, estimating ~170 km2 of urban land, about half the exponential projection (~329 km2). The 2010-2020 compound annual growth rate yields a nearly identical estimate (~169.8 km2), reinforcing the linear fit. This outcome indicates that Siguiri’s growth is expected to continue at a steady pace rather than accelerating exponentially.
Compared with global forecasts, Siguiri’s projected growth can be considered moderate rather than excessive. Seto et al.1 estimated that global urban land would expand by about 1.5 million km2 by 2030, with the fastest growth occurring in developing regions. Similarly, global analyses forecast that urban land in developing regions will expand dramatically by 2030, with many cities experiencing declining densities and extensive land-consuming growth9. In contrast, Siguiri’s modeled increase of approximately 30-35 % in urban extent between 2020 and 2030 represents a slower but still substantial expansion. This more tempered trajectory may reflect geographic barriers such as rivers and mining zones that restrict developable land. Nevertheless, the 2030 urban footprint will remain vastly larger than in 1990 (Fig. 7 and 8), underscoring the need for stronger land-use planning and infrastructure management to ensure sustainable growth.
|
Implications for sustainable urban planning: The forecasted growth of ~170 km2 by 2030 highlights the urgent need for forward-looking land-use planning. If unmanaged, such expansion could drive unplanned sprawl, strain infrastructure, and cause habitat loss. However, the modeled infill-and-edge expansion pattern offers a sustainable alternative, supporting higher densities, shorter travel distances, and reduced land consumption1.
Consistent with evidence from global urban planning studies, proactive growth management strategies are essential, including the designation of planned expansion zones, coordinated extension of trunk infrastructure, and protection of ecologically sensitive land9,10. The identified high-potential expansion zones (Fig. 5) can serve as a guide for zoning and service delivery planning. Although simplified, this model demonstrates how a proximity-based framework can inform sustainable expansion strategies, helping cities like Siguiri “grow in before growing out.”
CONCLUSION
Siguiri-Centre is undergoing rapid and continuous urban expansion, with projections indicating a substantial increase in built-up area by 2030. The spatial modeling results reveal a predominantly compact growth pattern concentrated around existing urban cores. This suggests that, with effective land-use planning, the city can accommodate future population and economic pressures while minimizing urban sprawl and environmental degradation. The findings emphasize the necessity of incorporating spatial forecasting tools into local urban planning to support sustainable development. Strengthening institutional capacity, enhancing spatial data availability, and adopting evidence-based planning policies are critical to ensuring balanced urban growth, resource conservation, and improved urban livability.
SIGNIFICANCE STATEMENT
This study presents a practical and reproducible approach for forecasting urban growth in data-scarce developing regions. It directly supports Sustainable Development Goal 11 (Sustainable Cities and Communities) by promoting compact, data-informed urban expansion strategies. The research provides valuable insights into the spatial dynamics of urbanization in Guinea and the broader West African region, offering a framework for policymakers to integrate spatial modeling into sustainable urban planning and management.
REFERENCES
- Seto, K.C., M. Fragkias, B. Güneralp and M.K. Reilly, 2011. A meta-analysis of global urban land expansion. PLoS ONE, 6.
- Mohammadyari, F., A. Zarandian, M.M. Mirsanjari, J.S. Visockiene and E. Tumeliene, 2023. Modelling impact of urban expansion on ecosystem services: A scenario-based approach in a mixed natural/urbanised landscape. Land, 12.
- Traore, A. and T. Watanabe, 2017. Modeling determinants of urban growth in Conakry, Guinea: A spatial logistic approach. Urban Sci., 1.
- Jedwab, R., L. Christiaensen and M. Gindelsky, 2017. Demography, urbanization and development: Rural push, urban pull and … urban push? J. Urban Econ., 98: 6-16
- Allen, J. and K. Lu, 2003. Modeling and prediction of future urban growth in the Charleston Region of South Carolina: A GIS-based integrated approach. Conserv. Ecol., 8.
- Pontius, R.G., D. Huffaker and K. Denman, 2004. Useful techniques of validation for spatially explicit land-change models. Ecol. Modell., 179: 445-461
- Venter, Z.S., D.N. Barton, T. Chakraborty, T. Simensen and G. Singh, 2022. Global 10 m land use land cover datasets: A comparison of dynamic world, world cover and Esri land cover. Remote Sens., 14.
- Burnham, K.P. and D.R. Anderson, 2002. Model Selection and Multimodel Inference: A Practical Information-Theoretic Approach. 2nd Edn., Springer, New York, ISBN: 978-0-387-22456-5, Pages: 488.
- Seto, K.C., B. Güneralp and L.R. Hutyra, 2012. Global forecasts of urban expansion to 2030 and direct impacts on biodiversity and carbon pools. Proc. Natl. Acad. Sci. U.S.A., 109: 16083-16088.
- Dodman, D., H. Leck, M. Rusca and S. Colenbrander, 2017. African urbanisation and urbanism: Implications for risk accumulation and reduction. Int. J. Disaster Risk Reduct., 26: 7-15.
How to Cite this paper?
APA-7 Style
Camara,
M. (2025). A Simplified Approach for Modeling Urban Growth in Siguiri-Centre, Guinea. Asian Journal of Emerging Research, 7(1), 96-103. https://doi.org/10.3923/ajer.2025.96.103
ACS Style
Camara,
M. A Simplified Approach for Modeling Urban Growth in Siguiri-Centre, Guinea. Asian J. Emerg. Res 2025, 7, 96-103. https://doi.org/10.3923/ajer.2025.96.103
AMA Style
Camara
M. A Simplified Approach for Modeling Urban Growth in Siguiri-Centre, Guinea. Asian Journal of Emerging Research. 2025; 7(1): 96-103. https://doi.org/10.3923/ajer.2025.96.103
Chicago/Turabian Style
Camara, Moriken.
2025. "A Simplified Approach for Modeling Urban Growth in Siguiri-Centre, Guinea" Asian Journal of Emerging Research 7, no. 1: 96-103. https://doi.org/10.3923/ajer.2025.96.103

This work is licensed under a Creative Commons Attribution 4.0 International License.