
Validation of Groundwater Potential Models Using Statistical Techniques: Insights from Electrical Resistivity Method
-
Akande Victor O.

Department of Applied Geophysics, Federal University of Technology, Akure, Ondo, Nigeria
Adeyemo Igbagbo I.Department of Applied Geophysics, Federal University of Technology, Akure, Ondo, Nigeria
Boluwade Bisola S.Department of Applied Geophysics, Federal University of Technology, Akure, Ondo, Nigeria
Aruwaji SuccessDepartment of Applied Geophysics, Federal University of Technology, Akure, Ondo, Nigeria
Omole BoluwajiDepartment of Applied Geophysics, Federal University of Technology, Akure, Ondo, Nigeria
Gade AdefolarinwaDepartment of Applied Geophysics, Federal University of Technology, Akure, Ondo, Nigeria
| Received 27 Nov, 2025 |
Accepted 24 Jan, 2026 |
Published 25 Jan, 2026 |
Groundwater exploration is crucial for ensuring sustainable water supply, particularly in regions with increasing population and surface water scarcity. This study focuses on the application and correlation of Multi-Criteria Decision Analysis (MCDA) techniques in the evaluation of groundwater potentiality in the study area (Ilere) of Ondo state, Nigeria. The integration of geophysical, geological and remote sensing data was carried out using the Preference Ranking Organization METHod for Enrichment Evaluations (PROMETHEE-II) and the Technique for Order of Preference by Similarity to Ideal Solution (TOPSIS) models. The CRITIC and Entropy methods were employed for objective weight determination of seven key groundwater conditioning factors: Lithology, hydraulic conductivity, lineament density, transverse resistance, drainage density, elevation and transmissivity. The study utilized Python for data processing and modelling and thematic maps were generated within a GIS environment. The validation of the groundwater potential models was conducted using correlation analysis, Area Under The Curve (AUC) and p-values, achieving a “very good” performance rating with an AUC of 0.89 and a statistically significant p-value of 3.96e-7, indicating a strong relationship between the models. The study’s findings provide a robust framework for groundwater resource management in crystalline basement complex terrains, offering valuable insights for sustainable water development in similar regions.
INTRODUCTION
In crystalline basement environments, groundwater serves as a critical and often the “most important” in human life that it is considered a fundamental necessity for sustainability in both human and ecological systems1. It is invaluable, but yet a “finite” natural resource which is indispensable for domestic, agricultural, industrial and environmental use2. Groundwater is essential to the extent that environmental sustainability would be nearly impossible without it. It is also defined as an irreplaceable natural resource essential for sustaining life. It is obtained as a result of atmospheric inputs in the form of rainfall, fluvial systems including surface water channels and streamflow system and subterranean aquifers storing groundwater. As population growth intensifies, this vital resource is becoming increasingly scarce. To address the challenges posed by expanding populations and surface water shortages, groundwater exploration plays a crucial role in uncovering hidden water reserves beneath the Earth’s surface, ensuring a sustainable water supply and mitigating environmental challenges. In complex basement terrains, groundwater availability is largely influenced by geological structures such as fracture zones and joints, or by the presence of significant thicknesses of saturated materials overlying the basement, collectively referred to as aquifers3. An aquifer typically exhibits a vertical stratification that can be categorized into four hydrogeological units: The topsoil horizon, the weathered overburden (often referred to as the regolith), the weathered and fractured crystalline layer known as saprolite and the underlying unweathered crystalline basement, which generally acts as an aquitard due to its low permeability4. Despite their inherently low primary porosity and limited groundwater storage capacity, basement aquifers can serve as viable water sources when characterized by significant overburden thickness and the presence of structural discontinuities such as fractures and joints that enhance secondary permeability. This potential is particularly notable in regions where these features are laterally continuous5. In Southwestern Nigeria, crystalline basement aquifers are irreplaceable criteria in groundwater supply4. Specific basement lithologies, including foliated metamorphic units such as schist, weathered meta-sediment and migmatite gneiss, possess significant groundwater potential5-7. These lithologic units often develop secondary porosity through weathering and fracturing processes, enabling them to function as efficient zones for groundwater storage and transmission. Owing to the predominantly subsurface occurrence and minimal surface indicators of aquifer-bearing structures, geophysical methodologies, particularly electrical resistivity and electromagnetic profiling, have become crucial methods for delineating groundwater potential zones accurately with high spatial and structural resolution8. As a result, several researchers, including3,9,10 have conducted extensive hydrogeophysical investigations, particularly in crystalline basement complex terrains, to better understand and optimize groundwater resource exploration.
The integration of geological mapping, remote sensing imagery, Geographic Information System (GIS) and geophysical investigations significantly enhances the precision of groundwater exploration by delineating aquifer potential zones. Multi-Criteria Decision Analysis (MCDA); particularly techniques like the Analytical Hierarchy Process (AHP) and Criteria Significance Index (CSI) are essential for aggregating heterogeneous datasets and guiding site ranking decisions. Recent applications of MCDA have demonstrated robust groundwater potential zonation and optimization of target areas, contingent on the selection of appropriate decision-making frameworks11,12. To achieve a robust, full of alternatives, this study utilizes the PROMETHEE II (Preference Ranking Organization Method for Enrichment Evaluations) and the TOPSIS (Technique for Order Preference by Similarity to Ideal Solution) approach. Both well established in multi-criteria decision analysis. PROMETHEE II offers complete preference ordering through net flow scoring, while TOPSIS ranks alternatives based on relative proximity to an ideal solution. These methods have demonstrated efficacy in groundwater resource modeling when integrated with GIS and MCDA techniques13-16. Despite the effectiveness of MCDA models, validating their accuracy and reliability is crucial to ensure their practical applicability in groundwater exploration and management. Groundwater potential assessment typically relies on validation techniques to ensure the reliability and accuracy of predictive models. Traditionally, well data validation, which involves comparing model results with actual borehole or well yield data, has been widely used. However, while this method provides direct empirical verification, it presents several limitations like; limited special coverage, seasonal or long-term fluctuation in groundwater levels, measurement error and logistics problems. One of the key approaches to validation is inter-model correlation analysis, which compares the results of multiple models in determining the level of agreement and reliability17. Inter-model correlation helps to identify discrepancies between models, highlight areas of uncertainty and provide a measure of confidence in the generated results. Furthermore, model validation through statistical indicators such as the correlation coefficient, Area Under the Receiver Operating Characteristic Curve (AUC) and p-value provides a quantitative basis for evaluating predictive performance. These metrics offer insights into the strength of association, classification accuracy and statistical reliability of the models under investigation10,14,18.
The adoption of inter-model correlation is particularly beneficial in groundwater studies, where uncertainty in subsurface conditions and data limitations can introduce potential biases in model outputs. By comparing the results of PROMETHEE-II- CRITIC and TOPSIS-Entropy models, this study focused on enhancing the reliability of the PROMETHEE II technique in conjunction with CRITIC Objective weightage and TOPSIS-Entropy for groundwater potentiality index and rating of the study area, which will serve as a decision-support framework to stakeholders. The AUC metric, which measures the model’s ability to distinguish between high and low groundwater potential zones, and the p-value, which indicates statistical significance, are employed to validate the consistency of the models. Recent advancements in multi-criteria decision-making frameworks have extended classical PROMETHEE and ELECTRE models through the integration of advanced analytical tools. Arcidiacono et al.19 introduced a robust extension of PROMETHEE by incorporating methods such as Robust Ordinal Regression, Stochastic Multicriteria Acceptability Analysis (SMAA), the bipolar Choquet integral and the Multiple Criteria Hierarchy Process. Similarly, enhanced PROMETHEE and ELECTRE methodologies to accommodate hierarchical criteria structures, thereby improving their applicability to complex decision environments. The CRITIC (Criteria Importance Through Intercriteria Correlation) Methodology offers a data-driven framework for objectively determining criterion weights through intra-criteria variability and pairwise correlation analysis. This algorithm ensures that prioritization is driven by the relative performance of the best and worst criteria, ultimately generating a robust composite index. Python, with its high-performance library and computational efficiency, was employed to implement the CRITIC algorithm and process the model calculations. Groundwater potential assessment in this study area integrated multiple geospatial and hydrogeological factors, including transmissivity (T), hydraulic conductivity (K), transverse resistance (TR), lineament density (Ld), drainage density (dd), elevation and lithology class (L) derived from geoelectrical, geological and remote sensing datasets. Complementary recent applications in similar hard rock settings further validate the utility of Python-based CRITIC and Entropy weighting in MCDA frameworks10,20. This study aims to validate groundwater potential models using statistical techniques and insights derived from the electrical resistivity method.
METHODOLOGY
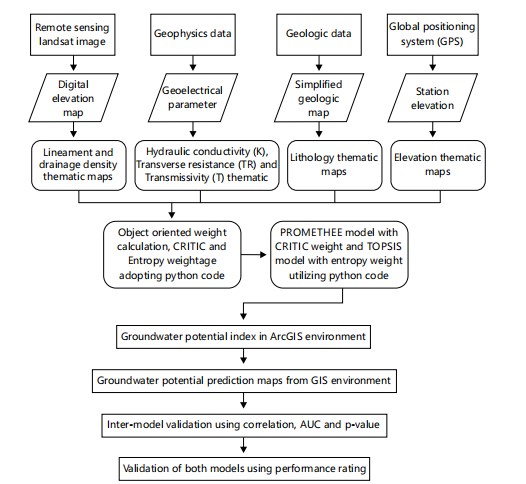
The study was conducted in several stages by integrating geology, geophysical data and remote sensing datasets. The first stage involves the collection of geophysical data using the electrical resistivity method (Vertical Electrical Sounding technique) and geological mapping for classifying the area to create a simplified geological map. A remote sensing dataset, including a Digital Elevation Model (DEM), was preprocessed to generate lineament density and drainage density maps, while elevation data was acquired via GPS. The acquired datasets were systematically processed and analyzed to delineate the groundwater potential across the study area. Spatial layers representing key controlling factors were generated and georeferenced within the ArcGIS environment to produce thematic maps essential for spatial modeling and multi-criteria evaluation. The thematic maps for these variables were generated in ArcGIS 10.8 utilizing the Inverse Distance Weighting (IDW) interpolation method. Subsequently, the CRITIC and Entropy weighting scheme, implemented in a Python environment, was employed to objectively quantify the relative importance of the selected criteria. The weighted parameters were then integrated using the PROMETHEE-II and TOPSIS ranking algorithm to compute a composite Groundwater Potential Index (GPI), facilitating a robust special prioritization of groundwater potential zones. This process culminated in the creation of a groundwater model map within a GIS environment for the study area. Figure 1, Flowchart of the methodology, illustrates the sequential steps of the study from data collection to analysis.
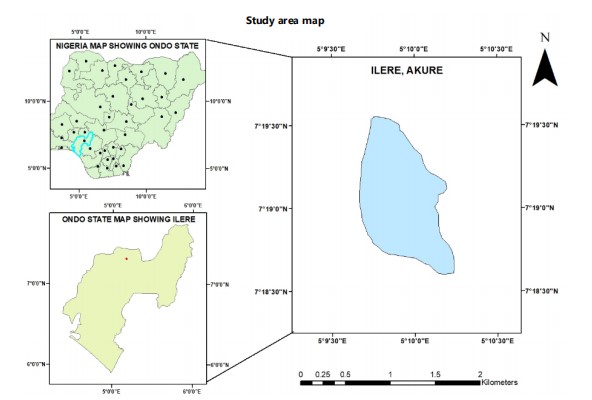
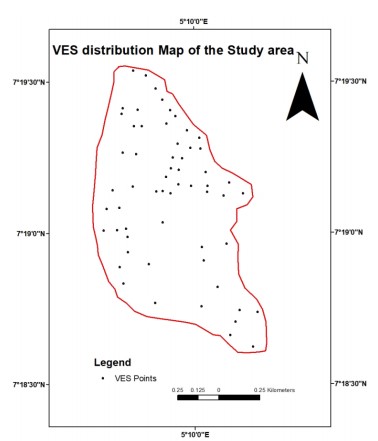
Location, site and accessibility: Ile here is situated in Ifedore local government area of Ondo State, in the Southwestern basement complex of Nigeria Fig. 2. The study area “Ilere” is located along Ijare road and data acquisition was between March and April, 2024. The geographic extent of the study area is defined using Universal Traverse Mercator (UTM) coordinates system, based on the Minna Datum (Zone 31N). Spatial boundaries span from Easting 738567 mE and 739035 mE and Northing 806719 mN and 812694 mN and Longitude 5°10’30’’E and 5°09’30’’E and Latitudes 7°19’30’’N and 7°18’30’’N. It is a well-built-up area and is accessible through major tarred roads, various untarred roads and footpaths.
|
|
|
|
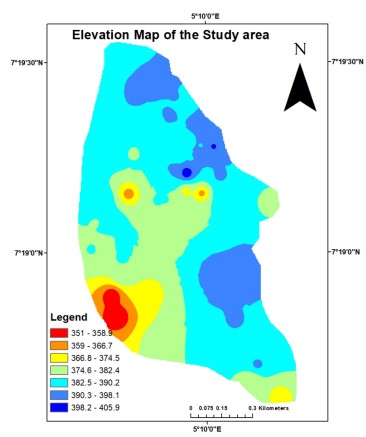
The study area comprises a partially built-up environment accessible via a network of major paved roads, secondary unpaved routes and pedestrian footpaths. Topographically, the terrain exhibits moderate to high undulations, with surface elevations ranging from approximately 354 m to 398 m above mean sea level (Fig. 3). The regional climate conforms to the typical Southwestern Nigerian pattern, characterized by the moisture-laden southwesterly monsoon and the arid northeasterly trade wind originating from the Sahara Desert. The rainy season extends from April to October, with peak precipitation typically occurring between August and October. Meteorological records indicate an average annual rainfall of 1546 mm, a mean annual temperature of 25.9°C and a relative humidity averaging 77%21.
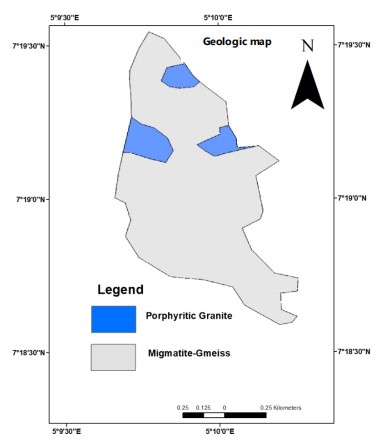
Geologically, the area lies within the Precambrian Basement Complex of Southwestern Nigeria14. The mapped lithological units predominantly comprise porphyritic granite and migmatite gneiss, with the latter occupying over 80% of the subsurface, thereby constituting the dominant rock formation across the study region Fig. 4.
Lithology: The lithologic framework of the study area was extracted from the simplified geology map of the study area. The area was mapped geologically, taking note of all the outcrops seen in the environment as well as their coordinates. The coordinated and rock types were saved into an Excel file, which was georeferenced using the ArcGIS environment. A shapefile delineating the study area was developed and utilized to generate the lithological map presented in Fig. 4.
Remote sensing and spatial analysis: Remote sensing techniques were employed to derive key morphometric parameters, specifically lineament and drainage density, crucial for groundwater potential assessment. Lineament features were extracted from Landsat 8 Operational Land Imager (OLI) imagery of the study area. In addition, a Digital Elevation Model (DEM) was acquired from the Shuttle Radar Topography Mission (SRTM) dataset via the United States Geological Survey (USGS) Earth Explorer portal. The DEM was reprojected to the Universal Transverse Mercator (UTM) coordinate system (Zone 31N, Minna Datum) to ensure spatial consistency during analysis.
Lineament detection was conducted using the PCI Geomatica 2012 software, applying edge enhancement and directional filtering techniques to improve feature delineation. The resulting linear features were processed using kernel Density Estimation (KDE) to generate a continuous surface representing lineament density, as illustrated in Fig. 5. For drainage density analysis, the hydrological workflow was implemented in ArcGIS, including the generation of flow direction and flow accumulation layers. The extracted drainage network was analyzed using the Line Density tool, producing the drainage density map.
Elevation: The Global Positioning System (GPS) was used for the collection of elevation data. The GPS was tuned to WGS 1984, Minna, Nigeria, 31N datum. The data was saved and georeferenced in a GIS environment, creating the elevation map Fig. 3, which shows the steepness of the area, which serves as a pointer to the degree of runoff and infiltration.
GEOPHYSICAL METHOD
Geophysics data acquisition in the study area was conducted using the Vertical Electrical Sounding (VES) method, specifically adopting the Schlumberger array electrode configuration. Electrode spacing (AB/2) was progressively increased from 1 m to a minimum of 300 m about a fixed central point to capture the vertical distribution of apparent resistivity in the subsurface. This array configuration enables improved resolution of deeper lithological units with increased electrode separation.
|
|
A total of fifty-nine VES stations were established across the study area to ensure adequate spatial coverage. Measurements of subsurface resistivity were obtained using the OHMEGA resistivity meter. Global Positioning System (GPS) receivers were used to georeferenced each VES location for subsequent spatial modeling and integration within a GIS environment. The layout of the VES stations is illustrated in Fig. 5.
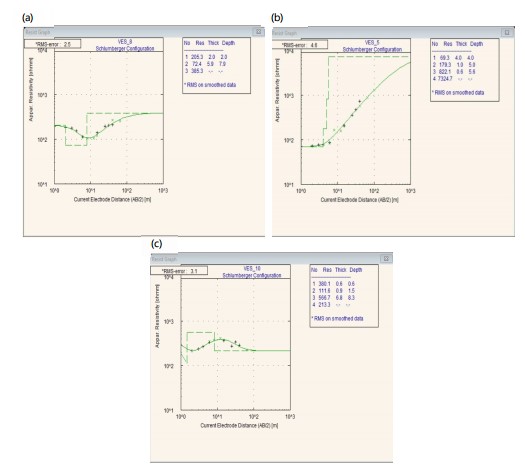
Field data were initially plotted as apparent resistivity versus half-current electrode separation (AB/2) on bi-logarithmic graph paper. Preliminary interpretations were performed through manual partial curve matching with standard master curves to generate smooth theoretical responses. Further refinement of the resistivity sounding curves was achieved using the 1D computer-based iterative inversion software. This enabled the derivation of geoelectrical parameters, including layer resistivity and thickness, which are essential for characterizing aquifer systems and delineating subsurface lithologic units. Representative VES curves from the study area are presented in Fig. 6(a-c), while a summary of the interpreted geoelectrical parameters is provided in Table 1.
Derived second order geoelectric parameters: Second-order geoelectric parameters, which is critical for evaluating aquifer hydraulic performance, were computed from the primary geoelectrical characteristics, namely layer resistivity and thickness, as obtained from the VES interpretation Table 1. These derived parameters include hydraulic conductivity (K), transverse resistivity (TR) and transmissivity (T), which serve as essential indicators in the delineation of groundwater potential zones.
The hydraulic conductivity (K), expressed in meters per day (m/day), was estimated using an empirical relationship that correlates aquifer resistivity (ρ) to hydraulic conductivity. The adopted equation is as follows:
| (1) |
where, is aquifer resistivity:
 |
(2) |
where, K is hydraulic conductivity and h is aquifer thickness:
Groundwater potential conditioning factors and gis modeling: The spatial groundwater potential of the study area was analyzed using seven conditioning parameters: Lithology, hydraulic conductivity (K), lineament density (Ld), transmissivity (T), transverse resistivity (TR), elevation and drainage density (dd). Thematic maps for these variables were generated in ArcGIS 10.8 utilizing the Inverse Distance Weighting (IDW) interpolation method. Primary geoelectrical data from Table 1 were used to compute hydraulic parameters, which subsequently formed the basis for geoelectric thematic layers, Fig. 7, 8. These GPCF thematic maps, Fig. 3, 4, 6-8 serves as input layers for the development of python-implemented PROMETHEE-CRITIC and TOPSIS-Entropy multi-criteria decision models. The hydrological importance of these conditioning factors for modeling groundwater potential in crystalline basement settings has been supported by recent studies in Nigeria22,23.
MODEL REVIEW
CRITIC weighting techniques: The Criteria Importance Through Intercriteria correlation (CRITIC) method is widely used objective weighting approach that assigns criterion weight based on both the variability and inter-criterion conflict, eliminating subjectivity from the weighting process. This data-driven method evaluates each criterion’s standard deviation and correlation with other criteria to derive a weight that reflects its discriminatory power24,25.
|
|
Initially, the decision matrix is normalized, typically using z-score standardization to ensure comparability across criteria. Subsequently, the standard deviation of each criterion vector is calculated to quantify its contrast intensity. Inter-criterion correlation coefficients are computed to assess the potential redundancy or conflict between criteria. CRITIC combines these two measures to calculate the information content for each criterion.
 |
(3) |
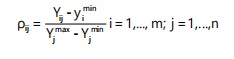
For benefit criteria:
 |
(4) |
| ρij | = | Standardized value of criterion j for alternative i | |
| yij | = | Original value of criterion j for alternative i | |
| yjmax and yjmin | = | Maximum and minimum observed values of criterion j, respectively | |
| m | = | Number of alternatives | |
| n | = | Number of criteria |
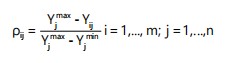
For cost criteria:
 |
(5) |
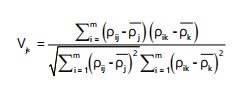
| J, k | = | 1,…..,n | |
| Vjk | = | Pearson correlation coefficient between criteria j and k | |
| ρ̄j and ρ̄k | = | Mean standardized values of criteria j and k, respectively |
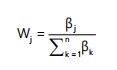 |
(6) |
| Wj | = | Normalized objective weight of criterion j | |
| = | Total information content across all criteria |
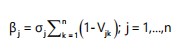 |
(7) |
Where:
| βj | = | Amount of information contributed by criterion j | |
| σj | = | Standard deviation of criterion j, representing its contrasting intensity | |
| (1-vik) | = | Degree of conflict (independence) between criteria j and k |
This process prioritizes criteria that are both highly variant and relatively independent, thus increasing decision-making robustness24. The CRITIC has been successfully deployed in environmental and water resource studies.
| Table 1: | Summary of the VES results obtained in the study area | |||
| Resistivity (Ωm) ρ1,ρ2......ρn | Thickness h1, h2…...hn (m) | Curve type |
| 40/1083/108/4023 | 1/1.5/7.8 | KH |
| 31/402/4234 | 3.9/4 | A |
| 59/101/2070 | 0.9/8 | A |
| 201/396/111/4634 | 2/0.4/3.6 | KH |
| 69/179/822/7325 | 4/1/0.6 | AA |
| 64/101/41/1666 | 3.7/1/26 | KH |
| 53/522/22/7407 | 0.4/0.8/3.7 | KH |
| 205/72/385 | 2/5.9 | H |
| 101/270/799/156 | 1.2/12.1/6.5 | AK |
| 380/117/567/213 | 0.6/0.9/6.8 | HK |
| 201/357/243 | 0.5/14.4 | K |
| 86/904/265 | 2.2/6.9 | K |
| 281/101/557/199 | 0.7/0.3/15.2 | HK |
| 533/324/639/180 | 0.6/1/9.7 | HK |
| 188/429/337/169 | 0.8/0.5/22.7 | KQ |
| 69/273/43/806 | 0.3/8.5/0.5 | KH |
| 48/387/528 | 0.2/0.7 | A |
| 244/462/254/440 | 0.6/1.3/8 | KH |
| 126/356/146 | 1.2/44 | K |
| 78/124/362 | 2.8/0.3 | A |
| 75/160/62/1422 | 0.7/2.2/4 | KH |
| 114/96/108/915 | 1.3/0.1/14.2 | HA |
| 144/944/109/955 | 0.3/1.5/7.5 | KH |
| 38/64/1656 | 0.4/3.9 | Q |
| 132/603/94/1088 | 0.2/1.8/7.4 | KH |
| 56/597/229/925 | 0.5/0.7/6 | KH |
| 111/273/5597 | 2.6/0.6 | Q |
| 148/1167/965 | 0.8/5.2 | K |
| 61/254/16/306 | 0.4/3.5/1.4 | KH |
| 153/31/220/1488 | 1/1.2/1.4 | HA |
| 420/46/1649 | 0.7/5.6 | H |
| 113/64/886 | 0.9/4 | H |
| 408/88/2747 | 0.2/6.9 | H |
| 91/24/639/4603 | 0.7/2.8/2.8 | HA |
| 234/29/1763 | 0.9/7.4 | H |
| 146/35/623 | 0.3/4.6 | H |
| 98/72/18/1500 | 2.2/0.2/1.4 | QH |
| 128/2478/477/648 | 1.5/0.1/4.2 | KH |
| 86/449/155/876 | 0.6/0.7/11 | KH |
| 298/163/755 | 1/9.9 | Q |
| 205/96/1274 | 0.5/6 | H |
| 121/130/2617 | 1.7/7.3 | A |
| 160/252/1917 | 5.2/0.2 | A |
| 50/125/2064 | 0.3/19.1 | A |
| 61/155/1615 | 0.8/11 | A |
| 218/169/1178 | 0.6/8.4 | H |
| 559/178/1040 | 0.4/15.9 | H |
| 258/116/597 | 0.3/5.9 | H |
| 239/61/151/794 | 0.7/0.8/10.9 | HK |
| 1226/228/863 | 0.5/17.2 | H |
| 126/33/138/327 | 2/0.6/0.4 | HK |
| 135/415/24/1506 | 0.7/2.3/5.1 | HK |
| 277/113/745 | 0.8/2.9 | H |
| 218/300/1617 | 9/10.2 | Q |
| 26/592/230/1224 | 0.3/0.8/12.1 | KH |
| 628/31/1599 | 2.1/2.6 | H |
| 249/143/906 | 3.6/15.4 | H |
| 140/209/1170 | 1.5/18.8 | A |
| 140/135/550 | 1.5/9 | H |
| A: ρ1<ρ2<ρ3, AA: ρ1<ρ2<ρ3<ρ4, AK: ρ1<ρ2<ρ3>ρ4, H: ρ1>ρ2<ρ3, H A: ρ1>ρ2<ρ3<ρ4, HK: ρ1>ρ2<ρ3>ρ4, K: ρ1<ρ2>ρ3, KH: ρ1<ρ2>ρ3<ρ4, Q: ρ1>ρ2>ρ3 and QH: ρ1>ρ2>ρ3<ρ4 | ||
ENTROPY METHOD
The entropy weighting technique is a non-expert, data-driven framework that objectively derives criterion weights by quantifying the degree of information dispersion within each indicator. This method utilizes probability distributions to evaluator. This method utilizes probability distributions to evaluate uncertainty: criteria with greater variability across alternatives contribute more informational value, resulting in higher entropy weights. In multicriteria groundwater modeling applications, weight computation follows a sequence of constructing a decision matrix, normalizing data, calculating entropy values and deriving criterion weights accordingly. Entropy-based weighting has proven effective in groundwater studies across basement complex terrains where expert bias must be minimized10,25-29. Equation 8 helps construct choice matrix by comparison of performance of each alternative.
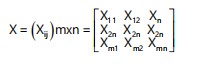 |
(8) |
Let, Xij represent the performance value of the ith alternative (i = 1, 2,…, m) with respect to the jth evaluation criterion (j = 1, 2,…,n) where m denotes the total number of feasible alternatives and n represents the number criteria under consideration.
Following the construction of the decision matrix, normalization is performed to eliminate unit discrepancies and standardize the input data. This is achieved by dividing each criterion value Xij by the sum of all values in the corresponding criterion column. The normalized value Pij is computed using Eq. 9:
 |
(9) |
This normalization step ensures that each criterion contributes proportionately to the entropy weigh computation, regardless of scale or magnitude.
After normalization, the entropy value Ej for each evaluation criterion Cj is computed using the following formulation:
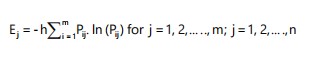 |
(10) |
Where:
| Pij | = | Normalized value of the ith alternative with respect to criterion j | |
| = | Constant that ensures the entropy value lies within the interval [0,1] | ||
| m | = | Number of alternatives | |
| n | = | Number of criteria |
The entropy weight Wj for each criterion as subsequently derived to reflect its degree of useful information, defined as:
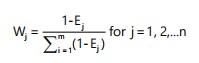 |
(11) |
This formulation ensures that criteria with higher variability across alternatives (i.e., lower entropy) are assigned greater weights, while more uniform criteria contribute less to the overall decision-making process.
Where:
 |
(12) |
PROMETHEE-II
The PROMETHEE-II method is a complete outranking-based ranking algorithm that supports comprehensive decision making across multiple alternatives and criteria. In this study, it is used to rank hydrological units based on weighted groundwater potential conditioning factors. Each criterion is evaluated pairwise using a preference function Pij (a,b), based on the performance difference dj (a,b) = gj (a) - gj (b) where gj represents the performance score of alternatives a and b for criterion j.
The methodology involves the following steps:
Preference computation:
dj (a,b) = gj (a)-gj (b) |
(13) |
Pj (a,b) = fi [dj (a,b)] |
(14) |
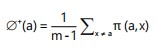
Aggregate preference index:
| (15) |
where, Denotes the weight assigned to each criterion (derived via methods).
Outranking flow calculation:
 |
(16) |
| (17) |
| (18) |
Here Ø+ (a) and Ø- (a) are the positive and negative outranking flows and Ø (a) is the net outranking flow used to produce the final ranking of alternatives.
This approach affectively handles multi-criteria comparisons and yields a deterministic ranking order (complete preordering) among all evaluated alternatives. PROMETHEE II is widely used in environmental and hydrological decision analysis due to its clarity, flexibility of preference functions and ability to handle conflicting criteria29,30.
TOPSIS METHODOLOGY
The Technique for Order Preference by Similarity to Ideal Solution (TOPSIS) is a prominent multi-criteria decision-making technique designed to rank alternatives by measuring their relative closeness to an ideal solution. This method is suited to evaluating groundwater potential zones when multiple spatial criteria must be reconciled quantitatively.
Normalization of decision matrix: To handle heterogeneity in units across benefit and cost criteria, each attribute xij in the decision matrix X = [xij]mxn is normalized using vector normalization:
| (19) |
This ensures comparability across criteria regardless of scale or dimension.
Weighted normalized decision matrix: The normalized values are weighted by the computed entropy weights Wj:
vij= rij . wj i=1,…, m; j=1,…., n |
(20) |
Where:
 |
Identification of ideal solutions: The positive (A+) and negative (A-) ideal solutions are defined as:
A+ = [v1+,…, vj+,..., vn+] |
(21) |
A- = [v1-,…, vj-,..., vn-] |
(22) |
Where:
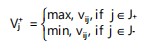 |
(23) |
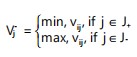 |
(24) |
Here J+ and J- are the sets of benefit and cost criteria, respectively.
Separation measures: The Euclidean distance from each alternative to the ideal solutions is computed:
| (25) |
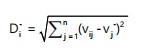 |
(26) |
Relative closeness to the ideal solution: The closeness coefficient Ci+ for each alternative is calculated as:
| (27) |
Higher values of indicate preference, signifying alternatives closer to the positive ideal and further from the negative ideal.
Ranking of alternatives: Alternatives are ranked in descending order of Ci+, with the higher-valued alternative deemed the most favorable groundwater potential site15.
DEVELOPMENT OF PROMETHEE-CRITIC AND TOPSIS-ENTROPY MODEL FOR GROUNDWATER POTENTIAL ZONING
In this study, a dual-model approach was employed to enhance the assessment of groundwater potential zones. The object-oriented PROMETHEE-CRITIC model served as the primary decision-making tool, while its outputs were validated using the entropy-based TOPSIS framework. Both models integrated seven key groundwater potential conditioning factors (GPCFs): Lithology (L), transverse resistivity (TR), hydraulic conductivity (K), lineament density (Ld), drainage density (dd), elevation and transmissivity (T). Model construction was carried out using a Python-based framework, where the number of GPCFs, spatial alternatives and corresponding weights for each criterion constituted the core input parameters. The modeling procedure was implemented in two distinct phases. In the first phase, objective weighting of criteria was performed using both the CRITIC method Table 2 and the entropy method Table 3. These computed weights were subsequently incorporated into the PROMETHEE-II and TOPSIS decision-making algorithms alongside the remaining input parameters.
Within both models, criteria were classified into two categories: Beneficial and non-beneficial (cost) attributes. Beneficial criteria are those for which higher values are preferred, whereas cost criteria represent factors where lower values are more desirable. Final model outputs-including the net outranking flow from PROMETHEE-II and the relative closeness index from TOPSIS were derived through the implemented python-based algorithms to establish robust rankings of groundwater potential across the study area.
RESULTS AND DISCUSSION
Analysis of groundwater potential conditioning factors: The groundwater potential conditioning factors (GPCFs) play a critical role in controlling grounding accumulation, storage and movement within aquifer systems. Their spatial variability and hydrological significance directly influence the delineation of zones with high groundwater potential. The relevance and contribution of each GPCF to groundwater occurrence in the study area are discussed in detail below.
Lithology: Lithology is a fundamental determinant of groundwater occurrence, particularly in basement complex terrains, where the nature and extent of rock weathering and fracturing significantly influence aquifer development. The study area is underlain predominantly by two major lithological units: Migmatite gneiss and Porphyritic Granitic Fig. 4. Among these, migmatite gneiss constitute approximately 90% of the geological framework. The groundwater storage capacity within this setting is primarily governed by the intensity of rock weathering and the presence of structural discontinuities, such as joints and fractures, which enhance secondary porosity. The higher degree of weathering associated with migmatite gneiss in the area suggests its increased potential to act as a productive aquifer zone relative to the more massive and less fractured granitic unit.
| Table 2: | CRITIC weight for each criterion | |||
| Criterion | Weight |
| Hydraulic conductance | 0.194254 |
| Trasverse resistance | 0.121312 |
| Tranmmissivity | 0.094101 |
| Elevation | 0.114733 |
| Drainage density | 0.114062 |
| Lineament density | 0.115873 |
| Lithology | 0.245665 |
| Table 3: | Entropy weight for each parameter | |||
| Parameter | Entropy | Weight |
| Hydraulic conductance | 0.953229 | 0.022549 |
| Trasverse resistance | 0.861414 | 0.066813 |
| Tranmissivity | 0.860059 | 0.067467 |
| Lineament density | 0.394045 | 0.292136 |
| Elevation | 0.984987 | 0.007238 |
| Lithology | 0.538861 | 0.222319 |
| Drainage density | 0.333183 | 0.321478 |
Lineament density: Lineaments are geomorphological expressions of subsurface structural discontinuities such as fractures, joints, faults, or lithological boundaries, which often serve as a preferential pathway for groundwater movement and storage. These features, commonly extracted from remote sensing data and Digital Elevation Models (DEMs), are critical in delineating zones of enhanced secondary porosity and permeability in crystalline basement terrains31.
In this present study, the lineament density map Fig. 7 was classified into five district categories: Very low, low, medium, high and very high. The spatial distribution reveals that over 98% of the study area exhibits very low to low lineament density, implying restricted groundwater potential in these zones. However, areas characterized by moderate to high lineament density indicate structurally enhanced aquifer potential due to increased fracture connectivity and water-bearing capacity. These structurally controlled zones are key targets for groundwater development in basement complex environments32.
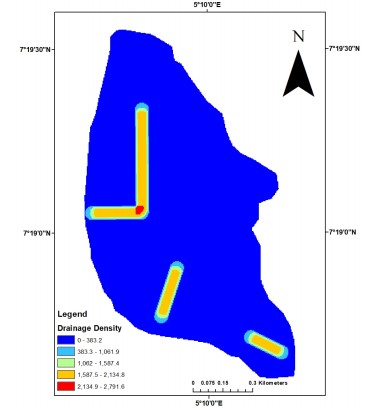
Drainage density: Drainage density, defined as the total length of streams per unit area, serves as an important indicator of surface runoff characteristics and infiltration capacity, both of which influence groundwater recharge potential. In this study, the drainage density map Fig. 8 classifies the region into five district zones: Very low, low, medium, high and very high.
Areas characterized by high drainage are indicative of increased surface runoff and reduced infiltration, conditions typically associated with shallow, impermeable subsurface and limited groundwater recharge potential. Conversely, regions exhibiting low drainage density suggest higher infiltration rates and prolonged water residence time, both of which enhance subsurface recharge and groundwater accumulation. Therefore, the spatial variation in drainage density directly informs the delineation of zones with differing groundwater potential within the study area.
Elevation: Elevation plays a critical role in controlling surface water runoff, infiltration dynamics and ultimately groundwater recharge. The elevation map of the study area Fig. 3 reveals spatial variability in topography, categorized into five classes ranging from very low to very high.
Zones characterized by very low to low elevation correspond to gently sloping terrain, which facilitates surface water retention, promotes infiltration and enhances the potential for groundwater accumulation. These physiographic settings are typically favourable for the development and sustainability of groundwater resources. In contrast, regions with moderate to very high elevation exhibit steeper gradients, which accelerate surface runoff, reduce infiltration capacity and limit recharge into the underlying aquifers. The topographic profile of the study area, therefore, significantly influences the spatial distribution of groundwater potential.
|
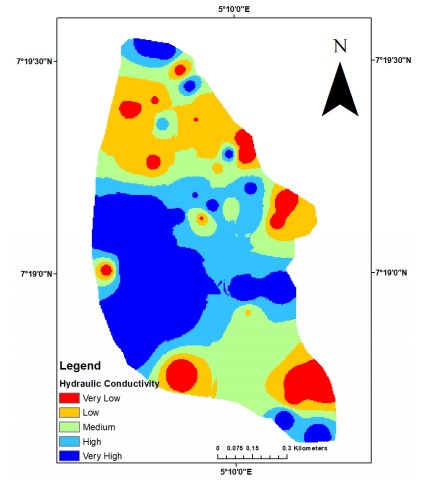
Hydraulic conductivity: Hydralic conductivity (K) quantifies an aquifer’s capacity to transmit water through interconnected pore spaces and fractures under the influence of a hydraulic gradient, serving as a key parameter in evaluating subsurface permeability and groundwater potential33. The hydraulic conductivity distribution across the study area is illustrated in the thematic map Fig. 9, highlighting spatial variability in aquifer transmissivity characteristics.
The influence of hydraulic conductivity on groundwater occurrence is well established, with higher K values typically associated with increased aquifer permeability and storage capacity. In this study, approximately 76% of the area is classified within medium to high hydraulic conductivity zones, indicating favourable conditions for groundwater movement and accumulation. The remaining 24% is characterized by low to relatively low K values, suggesting restricted groundwater flow potential. Although elevated K values are indicative of enhanced aquifer productivity, hydraulic conductivity alone may not be sufficient to fully assess the region’s groundwater potential. Its interpretation must be considered alongside other hydrogeophysical parameters such as transmissivity, aquifer thickness and structural features to obtain a comprehensive evaluation of groundwater resource viability.
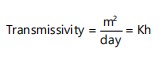
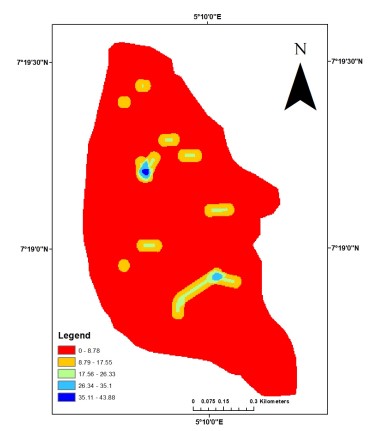
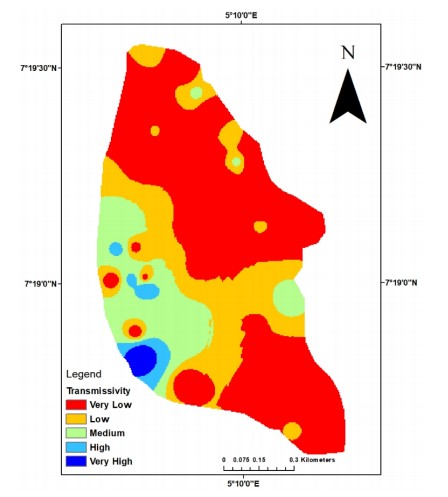
Transmissivity: Transmissivity (T) represents the capacity of an aquifer to transmit groundwater through its saturated thickness under a unit hydraulic gradient and it is a product of hydraulic conductivity and aquifer thickness. It reflects the volume of water that can be transmitted horizontally through a unit width of the aquifer10. High transmissivity values are indicative of aquifer systems with enhanced pore connectivity and fluid permeability.
The transmissivity distribution across the study area, as illustrated in the thematic map Fig. 10, is categorized into five classes: Very low, low, medium, high and very high. The spatial analysis reveals that approximately 65% of the study area falls within the very low to low transmissivity zones, signifying restricted groundwater flow and limited aquifer productivity in most parts of the region. Only a small proportion of the area exhibits moderated to high transmissivity, which suggests localized zones with relatively better groundwater potential. This pattern underscores the heterogeneity of the basement aquifer system and the influence of subsurface litho-structural variations on transmissivity values.
|
|
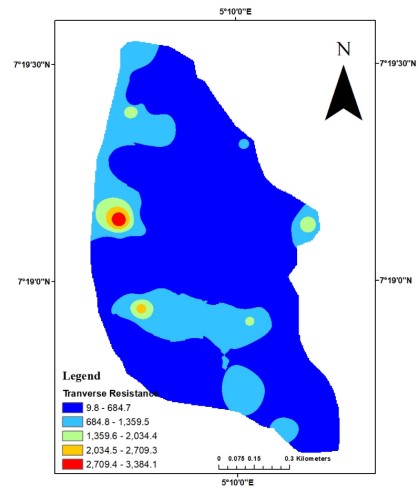
Transverse resistance: Transverse resistance (Tr) is useful for evaluating the hydraulic properties of aquifers, as it reflects both the resistivity contrast and thickness of groundwater-bearing formations. Higher traverse resistance values is an indication of resistive materials which do not favour groundwater accumulation. In basement complex terrains, where groundwater occurrence is often limited to fractured and weathered zones, transverse resistance provides a reliable indicator for identifying potential water-bearing zones and aquifer thickness variations. Fig. 11 depict that about 85% of the study area have low transverse resistance which favour groundwater potentiality.
GROUNDWATER POTENTIAL MODEL MAPS OF THE STUDY AREA
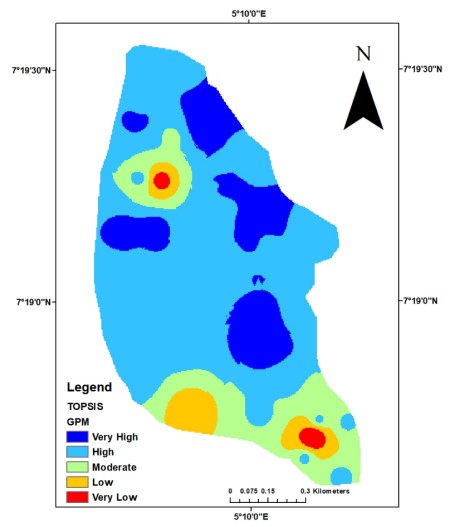
The groundwater potential of the study area was spatially modeled using two integrated Multi-Criteria Decision-Making (MCDM) approaches: PROMETHEE-CRITIC and TOPSIS-Entropy, both implemented in a python programming method environment. These techniques generated groundwater potential indices in form of net outranking flow (PROMETHEE) and relative closeness to the ideal solution (TOPSIS), which were subsequently used to construct thematic model maps Fig. 12 and13.
The resulting groundwater potential model maps were classified into five distinct zones-very low, low, medium, high and very-high using the Natural Breaks (Jenks) classification method, which optimizes class breaks to maximize intra-class similarity and inter-class differences patterns reveals that both models categorize the study area into major groundwater potential zones: (i) Low to very low and (ii) Moderate to very high.
Notably, the central portion of the study area is predominantly characterized by moderate to high groundwater potential, which can be attributed to favourable hydrogeologic conditions such as increased weathering, enhanced fracture density and optimal terrain morphology. Conversely, the southern region displays widespread areas of low to very low groundwater potential, indicating less favourable conditions for groundwater accumulation. These model outputs provide a reliable framework for prioritizing groundwater exploration and sustainable management efforts within the region.
|
|
|
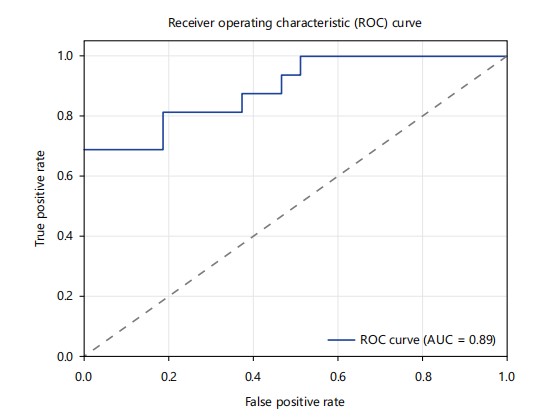
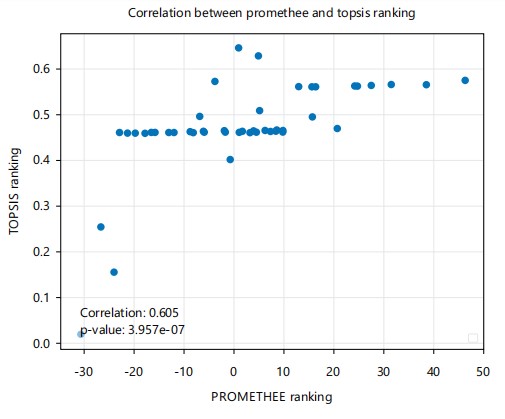
Validation of model: The predictive robustness of the developed groundwater potential models-PROMETHEE-CRITIC and TOPSIS-Entropy was quantitatively assessed using inter-model correlation analysis based on the Receiver Operating Characteristic (ROC) curve and associated statistical parameters Fig. 14 and 15. This validation aimed to evaluate the consistency between the groundwater potential indices (GPIs) generated by both models.
|
The classification performance was evaluated by computing the confusion matrix elements: True Positive (TP), False Positive (FP), True Negative (TN) and False Negative (FN). These were used to determine the True Positive Rate (TPR) and False Positive Rate (FPR) as given by the following equations:
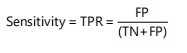 |
(28) |
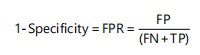 |
(29) |
The Area Under the Curve (AUC) value for both models was calculated as 0.89, signifying high predictive performance. Based on recent classification guidelines34, AUC values are interpreted as follows: 0.9-1.0 (excellent), 0.8-0.89 (very good), 0.7-0.79 (good), 0.6-0.69 (average) and below 0.60 (poor). Therefore, an AUC of 0.89 indicates a very good agreement between the model outputs.
The corresponding p-value for the inter-model comparison was calculated as 3.96×10⁻⁷, indicating a highly statistically significant correlation. Following current statistical thresholds35, p-values≤0.01 are considered excellent, between 0.01-0.05 as good, 0.05-0.1 as fair and >0.1 as poor.
The Pearson correlation coefficient (R) between the models was found to be 0.60, denoting a moderate positive correlation. This aligns with contemporary classification ranges, where R≥0.7 implies strong correlation, 0.5≤ R<0.7 indicates moderate correlation and R<0.5 represents weak correlation36.
These metrics collectively confirm the reliability and agreement of the PROMETHEE-CRITIC and TOPSIS-Entropy models for delineating groundwater potential zones in the study area.
This study applied PROMETHEE-CRITIC and TOPSIS-Entropy models to delineate groundwater potential zones in Ilere, southwestern Nigeria, using integrated geoelectrical, geological and remote sensing parameters. Seven conditioning factors-lithology, hydraulic conductivity, transmissivity, transverse resistance, lineament density, elevation and drainage density-were evaluated. The validation showed a
strong correlation between both models with an AUC of 0.89 and a p-value of 3.96e-7, confirming their reliability. The findings align with9,10 who also used hybrid MCDA models for aquifer potential in basement terrains with high reliability. Adiat et al.14 found similar predictive strength using geoelectrical parameters integrated with remote sensing and GIS. The role of lithology and lineament density as primary groundwater indicators is very important in the findings. The dominance of migmatite-gneiss and associated secondary porosity, as observed in this study, supports previous findings11. However, the study’s inability to validate with direct comparison with borehole yields as a result of difficulty in getting borehole yield data around the area. Future studies should prioritize borehole yield validation which will strengthen empirical reliability. Expanding the model across different geological zones could also improve its transferability for broader water resource management.
CONCLUSION
This study successfully applied the PROMETHEE-II and TOPSIS-Entropy models in groundwater potential mapping for the study area, utilizing a combination of geophysical, geological and remote sensing data. The integration of the CRITIC and Entropy weighting techniques provided an objective approach to criteria importance, enhancing the reliability of the groundwater potentiality index. Results demonstrated a significant correlation confirming the robustness of the applied methodologies. The groundwater potential zones identified in the study provide crucial information for stakeholders in water resource management, enabling better planning and sustainable utilization of groundwater resources. Future research could expand on this approach by incorporating additional hydrogeological parameters and refining the model for broader applications in similar geologic settings.
Link to the python-based-model codes utilized:
SIGNIFICANCE STATEMENT
This study discovered the strong complementary performance of PROMETHEE-II and TOPSIS-Entropy models integrated with objective CRITIC and Entropy weighting for accurate groundwater potential mapping in crystalline basement terrains. These findings can be beneficial for groundwater planners, hydrogeologists and decision-makers involved in sustainable water resource management in data-scarce regions. This study will help researchers to uncover the critical zones controlling groundwater occurrence that many studies were not able to explore. Thus, a new framework for MCDA-based groundwater assessment may be arrived at.
REFERENCES
- Osinowo, O.O. and K.I. Arowoogun, 2020. A multi-criteria decision analysis for groundwater potential evaluation in parts of Ibadan, Southwestern Nigeria. Appl. Water Sci., 10.
- Lachassagne, P., B. Dewandel and R. Wyns, 2021. Review: Hydrogeology of weathered crystalline/hard-rock aquifers-guidelines for the operational survey and management of their groundwater resources. Hydrogeol. J., 29: 2561-2594.
- Adamu, L.M., R. Ayuba, K.G. Ugbena, O.T. Ijaleye, A.E. Sunday and B.O. Odey, 2025. Integrated geophysical appraisal of groundwater potential in a crystalline basement terrain using vertical electrical sounding: A case study from Chikun and Environs, North-Central Nigeria. J. Pure Appl. Sci. (Sci. Forum), 25: 239-254.
- Doro, K.O., C.O. Adegboyega, A.P. Aizebeokhai and M.A. Oladunjoye, 2023. The Ibadan Hydrogeophysics Research Site (IHRS)-An observatory for studying hydrological heterogeneities in a crystalline basement aquifer in Southwestern Nigeria. Water, 15.
- Ariyo, S.O., O.O. Bayewu, O.M. Ajibade, O.O. Odugbesan and G.O. Adeyemi, 2024. Lithological and structural factors affecting groundwater occurrence in Eruwa, South West Nigeria. Niger. J. Phys., 32: 179-191.
- Adiat, K.A.N., O.F. Ajayi, A.A. Akinlalu and I.B. Tijani, 2020. Prediction of groundwater level in basement complex terrain using artificial neural network: A case of Ijebu-Jesa, Southwestern Nigeria. Appl. Water Sci., 10.
- Ajayi, O., C.I. Konwea and P.O. Sodeinde, 2022. Groundwater potential assessment of the sedimentary and basement complex rocks of Ogun State, Southwestern Nigeria. J. Water Environ. Technol., 20: 248-260.
- Obini, N., M.N. Tijani, I.J. Inim and A. Lawal, 2025. Delineating groundwater potential zones (GWPZ) in part of basement complex of Southwestern Nigeria using integrated geophysical methods. Arabian J. Geosci., 18.
- Adeyemo, I.A., A.O. Adegoke, O.B. Ojo and O.T. Adeniyi, 2023. Integration of elevation, lithology and geoelectric parameters using analytical hierarchy process for groundwater potential evaluation in part of Akure Metropolis, Southwestern Nigeria. Asian J. Geol. Res., 6: 189-203.
- Mogaji, K.A. and O.F. Atenidegbe, 2024. Development of PROMETHEE-Entropy data mining model for groundwater potentiality modeling: A case study of multifaceted geologic settings in South-Western Nigeria. Acta Geophys., 72: 1957-1984.
- Ajayi, O.G., I.J. Nwadialor, J.O. Odumosu, O.O. Adetunji and I.O. Abdulwasiu, 2022. Assessment and delineation of groundwater potential zones using integrated geospatial techniques and analytic hierarchy process. Appl. Water Sci., 12.
- Badmus, G.O., B.J. Fagbohun, O.S. Ogungbemi, O.D. Akinyemi, A.M. Gbadebo and J.A. Oyedepo, 2024. Delineation of potential zones for groundwater recharge using integrated GIS-based AHP and CSI techniques in Ogun Waterside, Southwestern Nigeria. Water Supply, 24: 3326-3342.
- Adedotun, A.I., A.V. Oluwatimilehin, A.A. Adewale and S.S. Olumide, 2023. Comparative studies of subsurface layers’ competence evaluation using TOPSIS and AHP models at Ilaramokin, Southwestern Nigeria. Phys. Access, 3: 78-98.
- Adiat, K.A.N., A.O. Kolawole, I.A. Adeyemo, A.A. Akinlalu and D.O. Afolabi, 2024. Assessment of groundwater resources from geophysical and remote sensing data in a basement complex environment using fuzzy-topsis algorithm. Results Earth Sci., 2.
- Atenidegbe, O.F. and K.A. Mogaji, 2023. Modeling assessment of groundwater vulnerability to contamination risk in a typical basement terrain using TOPSIS-entropy developed vulnerability data mining technique. Heliyon, 9.
- Han, F., R.N. Alkhawaji and M.M. Shafieezadeh, 2025. Evaluating sustainable water management strategies using TOPSIS and fuzzy TOPSIS methods. Appl. Water Sci., 15.
- Rahmati, O., M. Avand, P. Yariyan, J.P. Tiefenbacher, A. Azareh and D.T. Bui, 2022. Assessment of Gini-, entropy- and ratio-based classification trees for groundwater potential modelling and prediction. Geocarto Int., 37: 3397-3415.
- Sarkar, S.K., R.R. Rudra, S. Talukdar, P.C. Das and M.S. Nur et al., 2024. Future groundwater potential mapping using machine learning algorithms and climate change scenarios in Bangladesh. Sci. Rep., 14.
- Arcidiacono, S.G., S. Corrente and S. Greco, 2018. GAIA-SMAA-PROMETHEE for a hierarchy of interacting criteria. Eur. J. Oper. Res., 270: 606-624.
- Kamaraj, P., M. Jothimani, B. Panda and C. Sabarathinam, 2023. Mapping of groundwater potential zones by integrating remote sensing, geophysics, GIS, and AHP in a hard rock terrain. Urban Clim., 51.
- Abatan, A.A., T. Osayomi, S.O. Akande, B.J. Abiodun and W.J. Gutowski Jr., 2018. Trends in mean and extreme temperatures over Ibadan, Southwest Nigeria. Theor. Appl. Climatol., 131: 1261-1272.
- Oyedele, A.A., 2019. Use of remote sensing and GIS techniques for groundwater exploration in the basement complex terrain of Ado-Ekiti, SW Nigeria. Appl. Water Sci., 9.
- Ibim, D.F. and G.N. Piate, 2023. Structural impact on aquifer hydraulic parameters in Okigwe and Environs, South Eastern Nigeria, using integrated geophysical and GIS processed remote sensing data. Bushwealth Acad. J., 8.
- Zhao, B., Y.B. Shao, C. Yang and C. Zhao, 2024. The application of the game theory combination weighting-normal cloud model to the quality evaluation of surrounding rocks. Front. Earth Sci., 12.
- Žižović, M., B. Miljković and D. Miljković, 2020. Objective methods for determining criteria weight coefficients: A modification of the CRITIC method. Decis. Making: Appl. Manage. Eng., 3: 149-161.
- Abdus-Salam, M.O., Y.O. Akinsanya, I.O. Salami, T.W. Adeniji and A.O. Falana et al., 2024. Entropy-weighted water quality index assessment of groundwater in Ibadan metropolis, Southwestern Nigeria. Discover Water, 4.
- Emmanuel, A.B., A.K. Abdul-Nafiu, A.A. Adewale and O.G. Moses, 2022. The relationship between morpho-structural features and borehole yield in Ilesha Schist Belt, Southwestern Nigeria: Results from geophysical studies. Earth Sci., 11: 16-28.
- Sun, X., 2021. Green city and regional environmental economic evaluation based on entropy method and GIS. Environ. Technol. Innovation, 23.
- Fahly, A.P., A. Fauzi, B. Juanda and E. Rustiadi, 2024. Analysis of rural peat environmental risk using PROMETHEE method in Riau Province, Indonesia. Decis. Sci. Lett., 13: 337-350.
- Lord, Z.E., A. Rasoulzadeh, A. Abedi, S. Alikhani and J. Fernández-Gálvez, 2025. Integrating geographic information systems and multi-criteria decision analysis for evaluating artificial groundwater recharge. Water Resour. Manage., 39: 3817-3836.
- Akinluyi, F.O., M.O. Olorunfemi and O.G. Bayowa, 2021. Application of remote sensing, GIS and geophysical techniques for groundwater potential development in the crystalline basement complex of Ondo State, Southwestern Nigeria. Sustainable Water Resour. Manage., 2021.
- Olomo, O.K., O.A. Danga and A.O. Aliyu, 2025. Exploration of quality groundwater through lineament delineation in Okene and its surroudings. Geosyst. Geoenviron., 4.
- Diminescu, A.M., G.E. Dumitran and L.I. Vuţă, 2019. Experimental methods to determine the hydraulic conductivity. E3S Web Conf., 85.
- Al-Ruzouq, R., A. Shanableh, S. Mukherjee, M.A. Khalil and M.B. Gibril et al., 2023. Comparative analysis of machine learning and analytical hierarchy analysis for artificial groundwater recharge map development. Environ. Earth Sci., 82.
- Pourghasemi, H.R., A. Gayen, M. Panahi, F. Rezaie and T. Blaschke, 2019. Multi-hazard probability assessment and mapping in Iran. Sci. Total Environ., 692: 556-571.
- Arabameri, A., B. Pradhan, K. Rezaei and C. Conoscenti, 2019. Gully erosion susceptibility mapping using GIS-based multi-criteria decision analysis techniques. CATENA, 180: 282-297.
How to Cite this paper?
APA-7 Style
O.,
A.V., I.,
A.I., S.,
B.B., Success,
A., Boluwaji,
O., Adefolarinwa,
G. (2026). Validation of Groundwater Potential Models Using Statistical Techniques: Insights from Electrical Resistivity Method. Asian Journal of Emerging Research, 8(1), 15-38. https://doi.org/10.21124/ajer.2026.15.38
ACS Style
O.,
A.V.; I.,
A.I.; S.,
B.B.; Success,
A.; Boluwaji,
O.; Adefolarinwa,
G. Validation of Groundwater Potential Models Using Statistical Techniques: Insights from Electrical Resistivity Method. Asian J. Emerg. Res 2026, 8, 15-38. https://doi.org/10.21124/ajer.2026.15.38
AMA Style
O.
AV, I.
AI, S.
BB, Success
A, Boluwaji
O, Adefolarinwa
G. Validation of Groundwater Potential Models Using Statistical Techniques: Insights from Electrical Resistivity Method. Asian Journal of Emerging Research. 2026; 8(1): 15-38. https://doi.org/10.21124/ajer.2026.15.38
Chicago/Turabian Style
O., Akande, Victor, Adeyemo Igbagbo I., Boluwade Bisola S., Aruwaji Success, Omole Boluwaji, and Gade Adefolarinwa.
2026. "Validation of Groundwater Potential Models Using Statistical Techniques: Insights from Electrical Resistivity Method" Asian Journal of Emerging Research 8, no. 1: 15-38. https://doi.org/10.21124/ajer.2026.15.38

This work is licensed under a Creative Commons Attribution 4.0 International License.