
Assessment of Aquifer Protective Capacity in a Basement Terrain: A Case Study of the Federal University of Technology Akure, Southwestern Nigeria, Using Geoelectric and Geologic Parameters
| Received 27 Nov, 2025 |
Accepted 14 Jan, 2026 |
Published 15 Jan, 2026 |
Background and Objective: Groundwater resource vulnerability in crystalline basement terrains is a growing concern due to limited natural filtration capacity. This study aimed to assess the aquifer protective capacity in part of the Federal University of Technology, Akure (FUTA) to identify zones with varying levels of groundwater protection and enhance sustainable groundwater development. Materials and Methods: A total of 25 vertical electrical soundings (VES) were conducted using the Schlumberger array with a maximum half-current electrode spread of 65 m. Data interpretation revealed 3 to 4 geoelectric layers: Topsoil, laterite/weathered layer, partially fractured basement and fresh basement. The interpretation also revealed the layer parameters (resistivity and thickness values). Dar-Zarrouk parameters were subsequently calculated to evaluate aquifer protective capacity. These parameters were integrated in a GIS environment using a weighted sum overlay analysis. Results: The topsoil resistivity ranged from 24 to 444 Ωm (thickness: 0.2-3.3 m), the weathered layer from 54 to 506 Ωm (thickness: 0.9-25.9 m) and the fractured basement from 89 to 320 Ωm. The resulting aquifer protective capacity map identified five protective zones: very low, low, moderate, high and very high. About 56% of the area falls under very low to low protection, 16% under moderate protection and 28% under high to very high protection, with higher protection zones mainly in the northern region. Conclusion: The study provides a comprehensive assessment of aquifer vulnerability across FUTA and demonstrates the utility of integrating geoelectrical and GIS techniques. The dominance of low protective capacity zones highlights the need for strategic groundwater management. Future work should include hydrochemical validation and seasonal monitoring to refine the protective capacity assessment.
INTRODUCTION
Groundwater stands as the foremost and often the most abundant source of fresh water across many regions worldwide, offering unparalleled reliability in meeting water needs. It is classified as a fundamental resource for domestic, agricultural and industrial applications, particularly in regions with limited surface water availability1-3. Groundwater refers to the water located beneath the ground surface, filling the pore spaces between grains in sedimentary rocks and permeating cracks and crevices in all rock types4. Rain and snow are the main sources, with some of this precipitation seeping into the ground. Factors like climate, slope, soil and rock composition and vegetation affect how much precipitation infiltrates into the ground5-8. Typically, about 15% of total precipitation becomes groundwater, but this figure varies locally and regionally, ranging from 1 to 20%. Daily importance of groundwater leads to increase in global demand for fresh water and assessing aquifer protective capacity becomes crucial for contamination prevention9,10.
Groundwater vulnerability is the propensity and likelihood of contaminants, starting from the ground surface, to infiltrate and reach the groundwater table11. Aquifer vulnerability is influenced by geological formations that control groundwater movement and storage12. Aquifer vulnerability refers exclusively to the extent to which the physical and biochemical properties of the subsurface either hinder or promotes the movement of pollutants into the aquifer. Protective capacity, which help ameliorate the effect of how vulnerable an aquifer is largely dependent on the permeability and thickness of overlying materials, which can be effectively evaluated using geophysical methods such as electrical resistivity surveys13-17. These surveys provide a non-invasive means of assessing subsurface conditions and aid in sustainable groundwater direction18,19. The permeability and thickness of protective layers generated from the resistivity techniques are key factors influencing aquifer protective capacity. The integration of layer resistivity and longitudinal conductance (Secondary geo-electric parameter/Dar-Zarrouk parameter) holds direct applicability in aquifer protection studies.
Resistivity variations in subsurface materials are dictated by water content, porosity and mineralogical composition. High resistivity values typically indicate impermeable formations, while lower values suggest increased permeability, potentially facilitating contaminant infiltration20,21. Urbanization, industrialization and improper waste disposal exacerbate groundwater contamination risks, emphasizing the need for protective capacity assessments.
This research is aimed at characterizing the aquifer’s protective capacity using vertical electrical sounding (VES) within the study area. The findings will contribute to the development and effective management of water resources in the study area.
MATERIALS AND METHODS
Location, geomorphology, climate and vegetation of the study area: The study area is situated near the student union building of the Federal University of Technology, Akure Fig. 1(a-b). Its geographical coordinate ranges from 736477 to 736331 m (Easting) and 807932 to 807770 m (Northing) Fig. 1(a-b). The area is highly accessible through Jibowu hostel road and also through the Student Union building road. The study area exhibits an elevation ranging from 376 to 388 m above sea level, characterized by a gentle slope.
It falls within the sub-equatorial climatic belt and is influenced by the easterly wind current, which significantly impacts its rainfall patterns. Rainfall data for Akure indicates that it rains throughout the year, with the onset in March and a sharp decrease in November. The months from June through September are critical, experiencing high rainfall amounts that increase the likelihood of soil erosion and flooding. The peak rainfall months, July and September, are particularly significant due to sporadic, heavy downpours that can exceed 40 mm in a single day, contributing to an average annual rainfall of 1333.2 mm22.
The annual mean temperature is 33, with a mean minimum of 18. From June to September, evaporation rates are low (3.3 to 4.0 mm per day). Relative humidity ranges from 50 to 90%, depending on the season23,24. The region features tropical rainforest vegetation, with a mix of grasses and scattered trees.
 
|
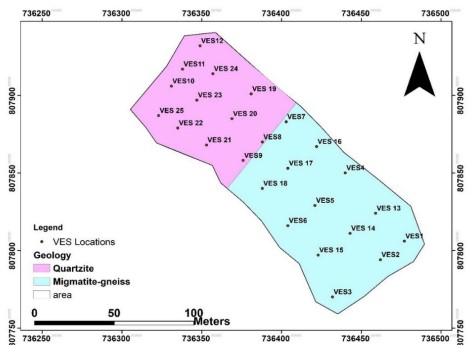
Geology of the study area: The geology of Nigeria is part of the remobilized part of the basement rocks of West Africa25-28. The major rock types in Akure are the schist belts, which are low to medium grade supracrustal, the gneiss-migmatite-quartzite complex, the Pan African granitoids (Older Granites) and other related rocks such as charnockite rocks and syenites, meta-igneous rocks, minor felsic and mafic intrusive29. The rocks have been found as intrusive bodies in the migmatite-gneiss-quartzite complex. The study area geology is composed of Migmatite Gneiss and Quartzite.
|
Hydrogeology of the study area: The basement bedrocks are associated with low porosity and trivial permeability. This is as a result of their composition29. Hence, accessibility of groundwater in crystalline bedrock is attributed to the formation of secondary porosity and interconnected pores as a result of weathering and fractures30. Figure 2 shows the geological formations of the study area. However, previous research on groundwater in crystalline bedrock of Nigeria has focused more on the weathered formations31,32, which are believed to be a very reliable aquifer in those places where it is deep enough. The water yield may be further enhanced where the weathered basement is underlain by fracture zones, a porous and deep network of joints and fractures or fissures in the parent rock and some of the greatest water needs occur in regions underlain by the basement complex33.
The geoelectric sounding survey was conducted using the Schlumberger configuration with a total of 25 vertical electrical sounding (VES) locations, which were selected based on accessibility and geological relevance. The electrode separation (AB/2) was varied from 1 to 65 m, allowing for sufficient depth penetration to delineate aquifer layers. The VES data were analyzed utilizing both partial curve matching and computer-based inversion techniques.
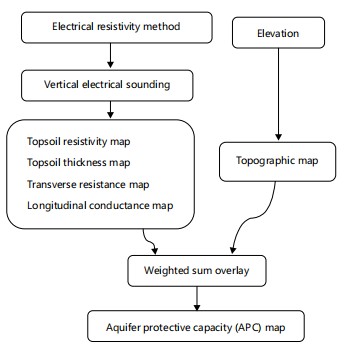
The initial primary layer parameters (resistivity and thickness values) were used to calculate secondary parameters: Transverse resistance (T), Longitudinal conductance (S) and Coefficient of Anisotropy. Hence, the production of each map. The maps were synthesized in a GIS-based environment using the weighted sum overlay for protective capacity, assigning a weight to each criterion based on its relative importance. The weighted sum overlay method was used to generate a protective capacity map from estimated parameters: Longitudinal conductance (l), transverse resistance (R), elevation (E), topsoil thickness (T) and topsoil resistivity (R).
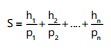
Mathematically, for a stratified medium consisting of “n” layers, the total longitudinal unit conductance (S) is determined by the following expression34,35:
 |
(1) |
where, S represents the longitudinal conductance, h is the layer thickness, p denotes the layer thickness n is the number of layers.
The coefficient of Anisotropy (λ) is calculated by substituting the longitudinal resistivity (pL) and transverse resistivity (ρt) into the equation34,35:
 |
(2) |
The results of these second-order parameters were used to produce maps illustrating longitudinal conductance and the coefficient of anisotropy, which are crucial for assessing aquifer vulnerability.
RESULTS AND DISCUSSION
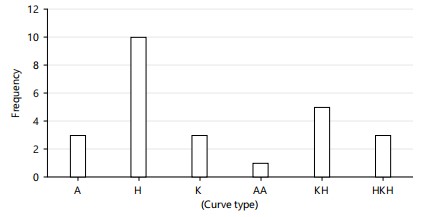
Vertical electrical sounding results: Based on the qualitative and quantitative analysis of the VES data using partial curve matching and subsequent computer iteration with the resist software package, the results, which detail the geoelectric parameters, are presented in Table 1. The various curve types were determined through the qualitative interpretation of the VES data. Six curve types were identified from the survey, which are A, H, K, AA, HK and HKH. The combined curve types in the form of AA, HK and HKH are typical of four and five-layer cases, respectively with varying geological characteristics. The K curve is typical of a three-layer case, which constitutes 12% of the curve type in the study area. H curve is the dominant curve in the study area with a percentage of 40%. The AA curve type took 4% while A, KH and HKH curve types are 12% each (Fig. 3).
The presence of KH and HKH curves in basement complex environments implies that the fractured and weathered bedrock formations are present. These fractures can enhance groundwater flow, but they also may increase the vulnerability of groundwater to contamination, as pollutants can more easily travel through these fractures. Therefore, while H curves may indicate potential groundwater resources, they also highlight areas where groundwater may be more susceptible to pollution. The A curve type features a more resistant weathered layer beneath a less resistant top layer, often indicating low groundwater potential and reduced vulnerability to contamination. The K sounding curves often signal aquitards or low-yield confined aquifers, which generally suggest lower vulnerability to contamination due to their limited groundwater flow and lower permeability.
|
| Table 1: | Geoelectric sounding results | |||
| VES NO. | Resistivity (Ωm)ρ1/ ρ2/….../ ρn | Thickness (m) h1/h2/….../hn | Curve type |
| 1 | 113/54/2485 | 1.0/7.3 | H |
| 2 | 214/92/5082 | 1.3/18.4 | H |
| 3 | 176/334/89/4234 | 1.0/1.0/9.2 | KH |
| 4 | 116/166/104/5139 | 1.0/2.0/13.1 | KH |
| 5 | 102/89/3893 | 0.8/18.3 | H |
| 6 | 184/81/927 | 1.0/13.1 | H |
| 7 | 250/125/320/215/1200 | 0.8/1.2/5.0/16.1 | HKH |
| 8 | 159/54/333/118/6188 | 0.5/1.7/2.9/12.9 | HKH |
| 9 | 74/112/1009 | 1.4/10.0 | A |
| 10 | 250/74/506/129/1115 | 0.7/0.9/1.5/14.1 | HKH |
| 11 | 65/228/1150 | 1.0/20.0 | A |
| 12 | 218/246/632 | 0.9/25.9 | A |
| 13 | 254/97/969 | 0.8/4.3 | H |
| 14 | 89/141/10835 | 1.0/6.7 | K |
| 15 | 160/281/111/2224 | 0.5/1.5/3.7 | KH |
| 16 | 151/111/1095 | 0.7/7.1 | H |
| 17 | 418/115/1175 | 1.4/12.4 | H |
| 18 | 24/104/434 | 0.2/15.8 | K |
| 19 | 276/79/4983 | 3.3/6.6 | H |
| 20 | 51/78/127/8425 | 0.2/3.1/4.8 | AA |
| 21 | 33/178/131446 | 0.4/2.0/27.0 | KH |
| 22 | 444/185/1855 | 0.5/18.5 | K |
| 23 | 96/136/109/363 | 1.0/4.1/17.9 | KH |
| 24 | 698/153/497 | 0.7/3.2 | H |
| 25 | 367/59/199/3259 | 1.1/3.9/7.3 | H |
Geoelectric sequence in the area: The VES interpretation identifies three to four major geoelectric units in the study area: Topsoil, weathered layer, fractured basement and fresh basement. The topsoil resistivity range of 24-698 ohm-m, with the most occurring resistivity range being >200 ohm-m, with most of the values less than 300 ohm-m (40%). This suggests lithology in the suite of sands. The topsoil layer thickness ranges from 0.2 to 3.3 m, with the most frequently occurring being 0.6-1.0 m (56%). The second layer, presumably the weathered zone, exhibits resistivity values ranging from 54-334 ohm-m, with the majority of the values (80%) being less than 200 ohm-m. This indicates that the lithology in this layer likely consists of sandy clays and possibly clayey sands. The thickness of this layer varies between 0.9 and 4.1 m.
The fractured bedrock, where present, has resistivity in the range of 104-334 ohm-m. Lower resistivity in the zone shows lower saturation and high protective capacity conditions, while high resistivity depicts high groundwater saturation and higher vulnerability to contamination. The geoelectric basement is infinitely resistive in the entire area.
Aquifer protective capacity assessment in the study area: The assessment of aquifer protective capacity utilized the natural breaks classification method in ArcGIS, which organizes data into meaningful categories by identifying natural groupings and reducing variances within classes while enhancing differences between them. This method improves the clarification and accuracy of protective capacity mapping.
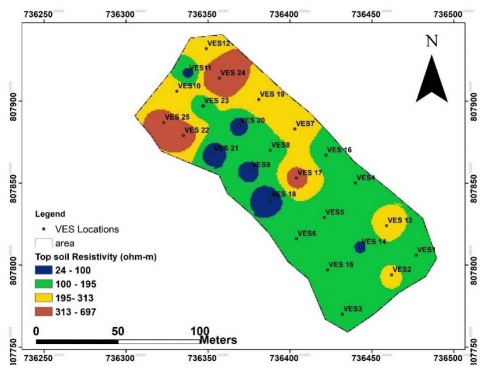
Topsoil resistivity map: The topsoil layer resistivity map shows the variation of topsoil resistivity values across all the 25 VES points in the study area. The topsoil overburden layer resistivity map shows that the area is characterized by four aquifer protective zones: very low, moderate and very high based on their resistivity contrast (Fig. 4). The areas with resistivity values of 24-100 m which is indicative of clay ,are considered to be of very high protective capacity due to itheir impervious nature areas with resistivity range of 100-195 m are delineated as moderate protective zones. Areas with resistivity range of 195-313 m are typical of low protective zones and they extend across the North Central and NW part and some parts of the SE part of the study area. The area with high resistivity values ranging from 313-697 m is considered to be of very low protective capacity occupying the NE and NW part of the study area. Protective capacity is usually inversely related to resistivity36.
|
|
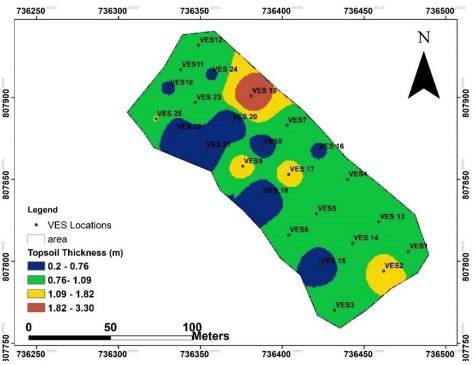
Topsoil thickness map: In aquifer vulnerability assessment, layer thickness is crucial because sufficiently thick layers above the aquifer can delay the travel time of contaminants to the aquifer, thereby mitigating the impacts of pollutants on the groundwater. The study area generally has a thin aquifer overlying material (generally less than 10 m).
|
The topsoil thickness across the area varies from 0.2 to 3.3 m (Fig. 5). Areas with a thickness of 0.2 to 0.76 m are considered to be of very poor aquifer protective capacity. Zones where topsoil thickness is between 0.76 to 1.09 m are ranked to be poor protective zones. Areas with a thickness range of 1.09 to 1.82 m are considered to be of moderate protective capacity, while areas where the overburden layer thickness are between 1.82 to 3.03 m are ranked to be of high protective capacity, occupying the northeastern part of the study area.
Topsoil thickness is linearly related to the aquifer protective capacity35,36. Regions with high topsoil thickness are inferred to have high protective capacity, moderate thickness zones are to have fair protective capacity and low thickness to have low protective capacity.
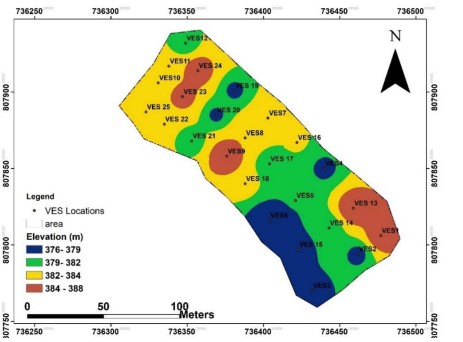
Topographic map: Figure 6 shows the elevation map of the study area, which was prepared using the elevation values at each VES station. Elevation is significant as it reflects terrain ruggedness, which is directly affected by the steepness of the topographic gradient. It also governs hydraulic gradients in a region and influences surface runoff direction and meteoric recharge21.
In a low-slope area, water is more likely to infiltrate the ground due to reduced surface runoff, thereby increasing the chance of pollutant infiltration. Conversely, steep slopes promote significant runoff, reducing the time pollutants spend on the surface and thus limiting infiltration. High infiltration rates can enhance groundwater vulnerability to contaminants, whereas low infiltration rates can reduce this vulnerability.
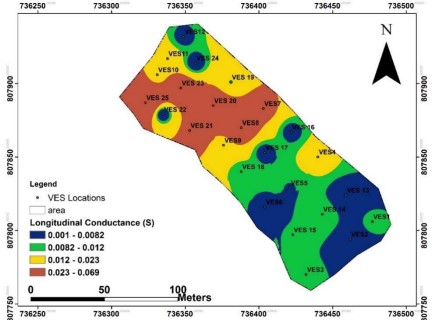
Longitudinal conductance map: The longitudinal conductance values, shown in Fig. 7, are essential for evaluating the overburden’s protective capacity in the study area. These values, which range from 0.01 to 0.069 mhos, indicate the earth’s ineffectiveness at filtering at slowing the movement of percolating fluids. Although highly impervious clayey overburden with higher longitudinal conductance values provides better protection to the underlying aquifer by preventing contaminants from passing through. The longitudinal unit conductance (S) was used to generate the longitudinal conductance map.
|
Zones with Longitudinal conductance values ranging from 0.001 to 0.0082 mhos with very low longitudinal conductance are considered as zones of poor protective capacity. The portion having longitudinal conductance values ranging from 0.0082 to 0.012 mhos was classified as a zone of weak protective capacity. Zones ranging from 0.012 to 0.023 mhos were classified as zones with moderate protection and where the conductance value is from 0.023 to 0.06 mhos, were considered to be of high protective capacity. The poor to weak protective zones dominate the Southeastern part, while the moderate to high protective zones dominate the northern part.
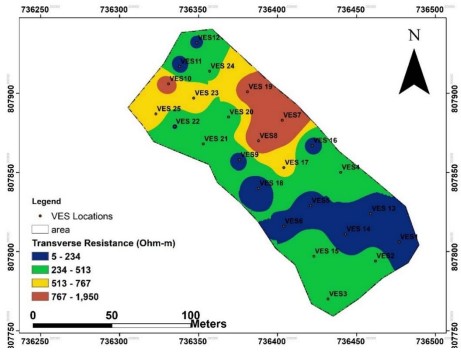
Transverse resistance map: Transverse resistance measures how subsurface materials resist pollutants since resistance is inversely related to protective capacity. High transverse resistance indicates that subsurface materials have high transmissivity and are porous and permeable. Areas with high porosity and permeability tend to have low protective capacity.
High transverse resistance can significantly impact aquifer protective capacity by increasing the infiltration and migration of pollutants through the aquifer. In Fig. 8, zones with low resistivity values less than 234 m are indicative of high protection, the range between 234 to 513 m is likely indicative of clayey sand is characterized to be of weak protection. Transverse resistance values between 513 to 767 m is classified as zone of moderate protection and areas above 767 to 1950 m are areas with poor protective capacity. The distribution of transverse resistance allows identification of regions with varying degrees of protective capacity in the study area.
Geologic map: The study area is located in the Basement Complex in Southern Nigeria, which comprises crystalline rocks25. It includes mainly of quartzite and migmatite gneiss (Fig. 9). In hard rock areas, the underlying rock is often brittle and prone to fracturing, which enhances water flow and accumulation. Consequently, the weathered and fractured basement rocks exhibit higher porosity and permeability and hence low protective capacity. Quartzite basically weathers into sand, which is of very low protective capacity, following lower resistivity values12,29,33,36. Migmatite gneiss is also associated with low protective capacity.
|
|
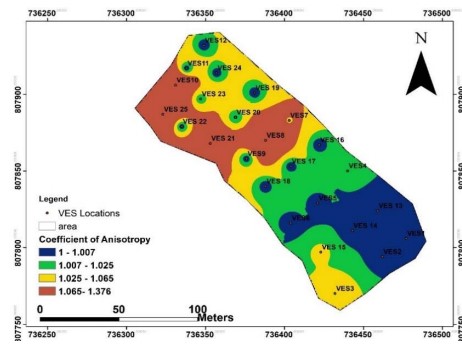
Coefficient of anisotropy map: The coefficient of anisotropy map, shown in Fig. 10, displays how this coefficient varies across the research area. Areas with a very low coefficient of anisotropy primarily have minimal geological structures that facilitate contaminants flow. These regions exhibit relatively uniform hydraulic conductivity. Areas with a low coefficient of anisotropy suggest a fairly isotropic aquifer with limited geological variations.
Regions with a high coefficient of anisotropy exhibit increased heterogeneity, revealing the presence of geologic features such as joints and fractures that can influence groundwater flow. Areas with a very high coefficient of anisotropy are characterized by prominent geological features, such as extensive joints and fractures, which create preferential flow paths and significantly affect aquifer protective capacity.
|
|
Generally, the area has low to moderate coefficient of anisotropy values (less than 1.5). The coefficient of anisotropy map of the study area is however indicative of low to moderate protective capacity.
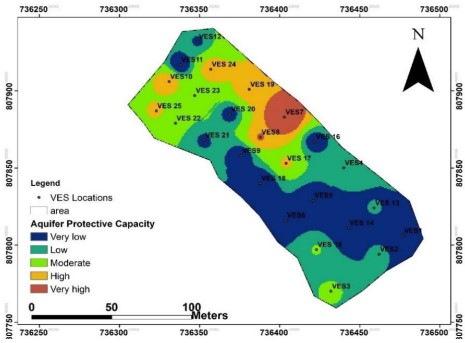
Aquifer protective capacity map: The assessment of the protective capacity of the aquifer units against contamination involves examining the capacity of the overlying vadose zone. This includes evaluating the thickness and longitudinal conductance of this layer. The protective capacity is estimated by integrating these factors along with transverse resistance, which influences groundwater accumulation and contributes to the overall aquifer protection mapping. The protective capacity map provides overall information on the vulnerability of the aquifer layers in the study area.
Figure 11 shows the aquifer protective capacity map of the study area. The topsoil layer resistivity map, topsoil layer thickness map, longitudinal conductance map and the transverse resistance map were overlaid in the GIS environment through application of weighted sum overlay to produce the aquifer protective capacity map of the area.
The protective capacity map (Fig. 11) shows that the protective capacity within the study area is poor and weak in some parts of the SE part of the study area. Other parts in the north central area are characterized by a moderate protective capacity rating. High to very high protective capacity is observed in the NE parts, except VES 10 and VES 25, which falls in the NW area. Areas that are classified as very low to low suggest zones of high infiltration rates from precipitation and runoff. Such areas are vulnerable to infiltration of leachate and other surface contaminants.
Generally, the study revealed that the overburden materials in the area around, especially in the southeastern portions, have moderate to high protective capacity. The extreme northern and the central portions have very low to low protective capacity materials. The overburden protective capacity map (Fig. 11) of the study area shows that about 28% of the area falls within the high protective capacity, while about 16% constitutes the moderate protective capacity rating and 56% constitutes the very low to low protective capacity zones. This suggests that the areas are underlain by materials of moderate to low protective capacity.
CONCLUSION
The study revealed that the study area shows that about 56% constitute the very low to low protective capacity zones. In comparison, another 28% of the area falls within the high protective capacity and only about 16% constitutes the moderate protective capacity rating. This suggests that the study area is generally underlain by materials of moderate to low protective capacity.
ACKNOWLEDGMENT
The authours ackmowledge the support of numerous students of Applied Geophysics Department, Federal Uiversity of Technology, Akure, Nigeria for their supports during the data acquisition of this work. The Department is also well apptreciated for allowing the use of departmental PASI Earth Resistivity meter.
REFERENCES
- Bayode, S., A.A. Akinlalu, K. Falade and O.E. Oyanameh, 2020. Integration of geophysically derived parameters in characterization of foundation integrity zones: An AHP approach. Heliyon, 6.
- Famiglietti, J.S., 2014. The global groundwater crisis. Nat. Clim. Change, 4: 945-948.
- Gleeson, T., M. Cuthbert, G. Ferguson and D. Perrone, 2020. Global groundwater sustainability, resources, and systems in the anthropocene. Annu. Rev. Earth Planet. Sci., 48: 431-463.
- Plummer, C.C., D. McGeory and D.H. Carlson, 1999. Physical Geology. 8th Edn., McGraw Hill Co. Inc., New York, pp: 48-56.
- Tsai, J.P., Y.W. Chen, L.C. Chang, W.F. Chen, C.J. Chiang and Y.C. Chen, 2015. The assessment of high recharge areas using DO indicators and recharge potential analysis: A case study of Taiwan’s Pingtung plain. Stochastic Environ. Res. Risk Assess., 29: 815-832.
- Setiawan, O., J. Sartohadi, M.P. Hadi and D. Mardiatno, 2019. Delineating spring recharge areas inferred from morphological, lithological, and hydrological datasets on Quaternary volcanic landscapes at the Southern flank of Rinjani Volcano, Lombok Island, Indonesia. Acta Geophys., 67: 177-190.
- Adagunodo, T.A., M.K. Akinloye, L.A. Sunmonu, A.P. Aizebeokhai, K.D. Oyeyemi and F.O. Abodunrin, 2018. Groundwater exploration in Aaba residential area of Akure, Nigeria. Front. Earth Sci., 6.
- Chowdhury, A., M.K. Jha and V.M. Chowdary, 2010. Delineation of groundwater recharge zones and identification of artificial recharge sites in West Medinipur District, West Bengal, using RS, GIS and MCDM techniques. Environ. Earth Sci., 59: 1209-1222.
- MacDonald, A.M., R.M. Lark, R.G. Taylor, T. Abiye and H.C. Fallas et al., 2021. Mapping groundwater recharge in Africa from ground observations and implications for water security. Environ. Res. Lett., 16.
- Adeyemo, I.A., G.O. Omosuyi, B.T. Ojo and A. Adekunle, 2017. Groundwater potential evaluation in a typical basement complex environment using GRT index-A case study of Ipinsa-Okeodu Area, Near Akure, Nigeria. J. Geosci. Environ. Prot., 5: 240-251.
- Omotola, O.O., M.I. Oladapo and O.J. Akintorinwa, 2020. Modeling assessment of groundwater vulnerability to contamination risk in a typical basement terrain case of vulnerability techniques application comparison study. Model. Earth Syst. Environ., 6: 1253-1280.
- Olorunfemi, M.O. and S.A. Fasuyi, 1993. Aquifer types and the geoelectric/hydrogeologic characteristics of part of the central basement terrain of Nigeria (Niger State). J. Afr. Earth. Sci. (Middle East), 16: 309-317.
- Abe, S.J., I.A. Adeyemo and O.J. Abosede-Brown, 2023. Geophysical approach for groundwater resource assessment: A case study of Oda Community Akure, Southwestern Nigeria. Adv. Geol. Geotech. Eng. Res., 5: 59-69.
- Gómez-Hernández, A., R. Rodríguez, A.L. del Río, E.A. Ruiz-Huerta and M.A. Armienta et al., 2020. Alluvial and gypsum karst geological transition favors spreading arsenic contamination in Matehuala, Mexico. Sci. Total Environ., 707.
- Adeyemo, I.A., O.A. Olumilola and M.A. Ibitomi, 2018. Geoelectrical and geotechnical investigations of subsurface corrosivity in Ondo State Industrial Layout, Akure, Southwestern Nigeria. Ghana Min. J., 18: 20-31.
- Mogaji, K.A., G.O. Omosuyi and G.M. Olayanju, 2011. Groundwater system evaluation and protective capacity of overburden material at Ile-OlujI, Southwestern Nigeria. J. Geol. Min. Res., 3: 294-304.
- Huang, Y., J.F. Kok, K. Kandler, H. Lindqvist and T. Nousiainen et al., 2020. Climate models and remote sensing retrievals neglect substantial desert dust asphericity. Geophys. Res. Lett., 47.
- Omosuyi, G.O., D.R. Oshodi, S.O. Sanusi and I.A. Adeyemo, 2021. Groundwater potential evaluation using geoelectrical and analytical hierarchy process modeling techniques in Akure-Owode, Southwestern Nigeria. Model. Earth Syst. Environ., 7: 145-158.
- Magesh, N.S., N. Chandrasekar and D.V. Roy, 2011. Spatial analysis of trace element contamination in sediments of Tamiraparani Estuary, Southeast Coast of India. Estuarine Coastal Shelf Sci., 92: 618-628.
- Adiat, K.A.N., A.O. Kolawole, I.A. Adeyemo, A.A. Akinlalu and D.O. Afolabi, 2024. Assessment of groundwater resources from geophysical and remote sensing data in a basement complex environment using fuzzy-topsis algorithm. Results Earth Sci., 2.
- Adeyemo, I.A. and G.O. Omosuyi, 2012. Geophysical investigation of road pavement instability along part of Akure-Owo express way, Southwestern Nigeria. Am. J. Sci. Ind. Res., 3: 191-197.
- Olujumoke, A.O., M.A. Folorunso, G. Valerie and B. Christian, 2016. Descriptive analysis of rainfall and temperature trends over Akure, Nigeria. J. Geogr. Reg. Plann., 9: 195-202.
- Adagunodo, T.A., A.I. George, I.A. Ojoawo, K. Ojesanmi and R. Ravisankar, 2018. Radioactivity and radiological hazards from a kaolin mining field in Ifonyintedo, Nigeria. MethodsX, 5: 362-374.
- Adagunodo T.A., O.S. Hammed, M.R. Usikalu, W.A. Ayara and R. Ravisankar, 2018. Data on the radiometric survey over a kaolinitic terrain in Dahomey Basin. Nigeria. Data Brief, 18: 814-822.
- Adagunodo, T.A., S. Luning, A.M. Adeleke, J.O. Omidiora and A.P. Aizebeokhai, K.D. Oyeyemi and O.S. Hammed, 2018. Evaluation of 0 ≤ M ≤ 8 earthquake data sets in African - Asian region during 1966-2015. Data Brief, 17: 588-603.
- Adagunodo, T.A., L.A. Sunmonu and M.E. Emetere, 2018. Heavy metals' data in soils for agricultural activities. Data Brief, 18: 1847-1855.
- Ademeso, O.A., 2009. Deformation traits in the charnockitic rocks of Akure area, Southwestern Nigeria. Asian J. Earth Sci., 2: 113-120.
- Akintorinwa, O.J., M.O. Atitebi and A.A. Akinlalu, 2020. Hydrogeophysical and aquifer vulnerability zonation of a typical basement complex terrain: A case study of Odode Idanre Southwestern Nigeria. Heliyon, 6.
- Adeyemo, I.A., A.A. Akinlalu, K.A. Mogaji and O.O. Odumosu, 2020. Integrated analysis of geophysical data for road networks sub base lithology integrity assessment case study in crystalline basement complex, Southwestern Nigeria. J. Geogr. Environ. Earth Sci. Int., 24: 15-28.
- Mogaji, K.A., O.F. Atenidegbe, I.A. Adeyemo and K.P. Akinmulewo, 2022. Application of GIS-based PROMETHEE data mining technique to geoelectrical-derived parameters for aquifer potentiality assessment in a typical hardrock terrain Southwestern Nigeria. Sustainable Water Resour. Manage., 8.
- King, P.L., A.J.R. White, B.W. Chappell and C.M. Allen, 1997. Characterization and origin of aluminous A-type granites from the Lachlan fold belt, Southeastern Australia. J. Petrol., 38: 371-391.
- Akinlalu, A.A., A. Adegbuyiro, K.A.N. Adiat, B.E. Akeredolu and W.Y. Lateef, 2017. Application of multi-criteria decision analysis in prediction of groundwater resources potential: A case of Oke-Ana, Ilesa Area Southwestern, Nigeria. NRIAG J. Astron. Geophys., 6: 184-200.
- Atenidegbe, O.F. and K.A. Mogaji, 2023. Modeling assessment of groundwater vulnerability to contamination risk in a typical basement terrain using TOPSIS-entropy developed vulnerability data mining technique. Heliyon, 9.
- Zhody, A.A.R., 1965. The auxiliary point method of electrical sounding interpretation, and its relationship to the Dar Zarrouk Parameters. Geophysics, 30: 644-660.
- Kosinski, W.K. and W.E. Kelly, 1981. Geoelectric soundings for predicting aquifer properties. Groundwater, 19: 163-171.
- del Toro-Guerrero, F.J., E.R. Vivoni, T. Kretzschmar, S.H.B. Runquist and R. Vázquez-González, 2018. Variations in soil water content, infiltration and potential recharge at three sites in a Mediterranean Mountainous Region of Baja California, Mexico. Water, 10.
How to Cite this paper?
APA-7 Style
Adedotun,
A.I., Orisajinmi,
O.D., Adeyemo,
I.A., Akande,
V.O. (2026). Assessment of Aquifer Protective Capacity in a Basement Terrain: A Case Study of the Federal University of Technology Akure, Southwestern Nigeria, Using Geoelectric and Geologic Parameters. Asian Journal of Emerging Research, 8(1), 1-14. https://doi.org/10.21124/ajer.2026.1.14
ACS Style
Adedotun,
A.I.; Orisajinmi,
O.D.; Adeyemo,
I.A.; Akande,
V.O. Assessment of Aquifer Protective Capacity in a Basement Terrain: A Case Study of the Federal University of Technology Akure, Southwestern Nigeria, Using Geoelectric and Geologic Parameters. Asian J. Emerg. Res 2026, 8, 1-14. https://doi.org/10.21124/ajer.2026.1.14
AMA Style
Adedotun
AI, Orisajinmi
OD, Adeyemo
IA, Akande
VO. Assessment of Aquifer Protective Capacity in a Basement Terrain: A Case Study of the Federal University of Technology Akure, Southwestern Nigeria, Using Geoelectric and Geologic Parameters. Asian Journal of Emerging Research. 2026; 8(1): 1-14. https://doi.org/10.21124/ajer.2026.1.14
Chicago/Turabian Style
Adedotun, Adeyemo, Igbagbo, Oluwayemisi D. Orisajinmi, Igbagbo A. Adeyemo, and Victor O. Akande.
2026. "Assessment of Aquifer Protective Capacity in a Basement Terrain: A Case Study of the Federal University of Technology Akure, Southwestern Nigeria, Using Geoelectric and Geologic Parameters" Asian Journal of Emerging Research 8, no. 1: 1-14. https://doi.org/10.21124/ajer.2026.1.14

This work is licensed under a Creative Commons Attribution 4.0 International License.