
Physicochemical Assessment of Achievers University Groundwater, Owo, Southwestern Nigeria
-
Seun Bewaji

Department of Geological Sciences, Achievers University, Owo, Nigeria
Ayodele Oluwasegun FaladeDepartment of Geological Sciences, Achievers University, Owo, Nigeria
Ayodeji Abayomi EdemaDepartment of Geological Sciences, Achievers University, Owo, Nigeria
Abdullai AdeyemoDepartment of Geological Sciences, Achievers University, Owo, Nigeria
| Received 15 Mar, 2025 |
Accepted 15 May, 2025 |
Published 16 May, 2025 |
Background and Objective: Achievers University depends mainly on borehole water as a means of water supply, and it is largely believed that borehole water is deemed safe and not exposed to contamination. This research set out to analyze the physicochemical parameters of the borehole water in the school and compare the parameters with the recommended standards. Materials and Methods: Eight boreholes were randomly selected from Achievers University. Standard techniques were used to take water samples from the boreholes. Field measurements for parameters such as pH, Total Dissolved Solids (TDS), electrical conductivity (EC), and temperature were conducted, alongside laboratory analysis of nitrate, sulfate, chloride, bicarbonate, calcium, sodium, magnesium, and potassium concentrations. Results: The nitrate concentrations ranged from 0.9 to 15.07 mg/L, chloride concentration ranged from 7.68 to 30.73 mg/L, sulphate concentration ranged from 0.57 to 13.29 mg/L, and bicarbonate concentration ranged from 42-108 mg/L. Calcium concentration ranges from 0.773-3.301 mg/L, sodium concentration ranges from 0.773-1.573 mg/L, magnesium concentration ranges from 0.497 to 1.179 mg/L, and potassium concentration ranges from 0.769 to 1.035 mg/L, with no sample exceeding the World Health Organization (WHO) and Standard Organization of Nigeria (SON) limit. The pH value falls within the range of 5.78 to 7.35, with sample SP2 having the lowest value slightly lower than the recommended value of (WHO), and the TDS ranged from 72 to 138 mg/L. The TDS and electrical conductivity levels were also within safe limits. The Piper diagram revealed that most samples were of the magnesium bicarbonate type, with some exhibiting calcium and bicarbonate dominance. The Gibbs plot indicated rock weathering as the primary mechanism influencing water chemistry. Conclusion: Overall, the study concluded that the borehole water in Achievers University is generally safe for consumption, except for the slightly acidic pH in one sample, which may require minor corrective measures. Regular monitoring is recommended to ensure sustained water quality.
INTRODUCTION
Water, a fundamental necessity for sustaining life, profoundly influences various aspects of existence1. It is indispensable for the survival of humans, animals, plants, and all living organisms2. Water serves multiple vital functions within the human body, including lubrication, temperature regulation, toxin elimination, and nutrient transportation3. Furthermore, the widespread occurrence of groundwater across the Earth’s surface is crucial for sustaining activities such as food production and nutrition, highlighting the critical dependence of human endeavors on the availability and quality of water resources4,5. A very large portion of the population depends on borehole water for drinking.
However, the quality of borehole water can be modified by numerous physicochemical qualities that represent its suitability for human consumption and cultivation.
Insights into the chemical makeup, stability, and health hazards of borehole water can be gained from physicochemical factors like pH, conductivity, turbidity, and dissolved oxygen levels. The pH level affects metal speciation and nutritional availability by influencing the solubility and mobility of chemical components in water6. The number of dissolved ions and salts is indicated by conductivity, which quantifies the water’s capacity to carry an electrical current. The presence of suspended particles, sediments, or microbiological pollutants is indicated by turbidity, which also reflects the water’s clarity. Low oxygen concentrations indicate poor water quality and perhaps hypoxic circumstances, while dissolved oxygen levels are essential for sustaining aquatic life and aerobic microbial processes7.
Determining the probable causes of pollution, evaluating the need for water treatment, and putting suitable remediation measures into place all depend on an understanding of the physicochemical properties of borehole water8. Monitoring these characteristics guarantees that communities have access to safe and dependable drinking water sources and permits early documentation of problems with water quality. Furthermore, understanding the chemistry of borehole water reduces the hazards to human health and the environment while promoting sustainable methods of managing water resources. Since borehole water is the main supply of residential water at Achievers University, drinking water quality is a major public health problem.
Despite its perceived purity, borehole water may be contaminated and deviate from the standard physicochemical properties, which can pose serious health risks if not quickly checked and controlled. This problem can be due to the lack of comprehensive studies and investigation of the physicochemical properties of borehole water, particularly in the Achievers University community of Owo. Without a thorough understanding of these parameters, it is challenging to evaluate the overall safety and purity of borehole water for human consumption purposes. Therefore, there is an urgent necessity to carry out a detailed analysis of the physicochemical properties of borehole water to identify potential health risks and implement effective mitigation measures. This study aimed to address this gap by examining the physicochemical properties of borehole water samples collected and comparing them with recommended standards.
MATERIALS AND METHODS
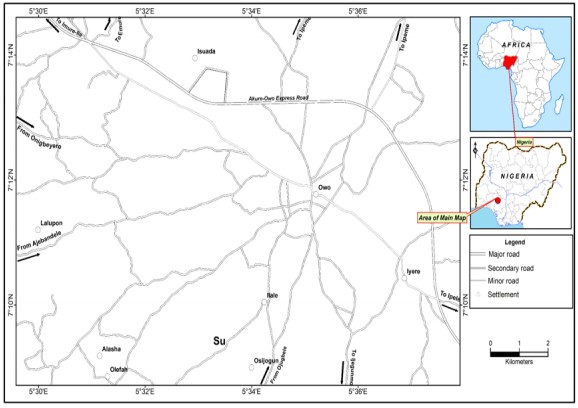
Location and accessibility: The research was conducted at Achievers University Owo, Nigeria, in March, 2024, which is situated within the historical and cultural backdrop of a city rich in Yoruba heritage. The region is delimited by Latitude 5°35'35.52"E and Longitude 7°11'56.04"N at an elevation of 305 m above sea level (Fig. 1). Owo, the local government headquarters of a vibrant Yoruba city-state between 1400 and 1600 AD, now serves as the administrative headquarters of the Ogho Imade Local Government Area in the Ondo State. With a population of 222,262, according to the 2006 census, and spanning an area of 253 km2, Owo embodies a dynamic urban landscape that is surrounded by both historical significance and contemporary development.
|
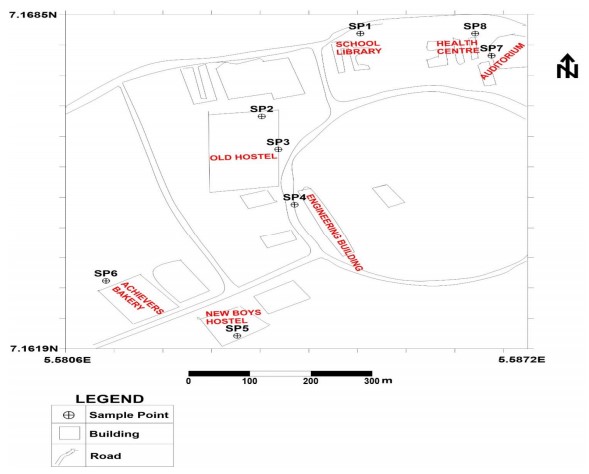
Sampling and sample preparation: Eight samples were collected randomly from various boreholes on the premises of Achievers University (Fig. 2). The sampling was carried out in March, which was the beginning of the rainy season. Before sample collection, all sampling bottles were carefully labelled to ensure proper identification. To minimize the risk of contamination, each bottle was thoroughly rinsed with the same well water being sampled. Hands were also washed with the sample water to prevent cross-contamination from other wells. Additionally, the bottle caps were rinsed with the sample water and tightly sealed to avoid any leakage. These samples were then transported to the laboratory in Akure within 24 hrs for further analysis.
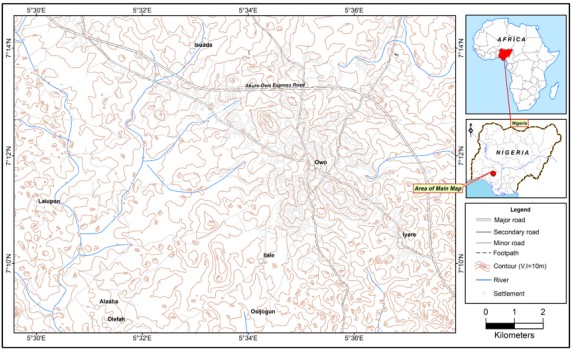
Climate and topography of the study area: The climate of Owo, including the area encompassing Achievers University, is classified as a tropical savanna. This climate type is characterized by wet and dry seasons. The subject area’s dendritic drainage pattern usually controls its geomorphology (Fig. 3). The wet season usually lasts from April to October, with the highest rainfall occurring between June and September. During this period, the area receives an average annual rainfall of approximately 1,300-1,500 mm. The dry season lasts from November to March and features significantly reduced precipitation and higher temperatures. Temperatures in Owo generally range between 24 and 34°C throughout the year, with the hottest months being February and March. Humidity levels were also relatively high, particularly during the wet season, with an average of approximately 70 to 80%9. Achievers University is located in Owo, Ondo State, a region characterized by a varied physical landscape. The topography of this area is predominantly undulating, with a mixture of gently rolling hills and flat plains. The elevation ranges from approximately 300 to 450 m above sea level, providing diverse terrain that influences several environmental factors10. The research area experiences between 900 and 1800 mm of annual precipitation11.
|
|
|
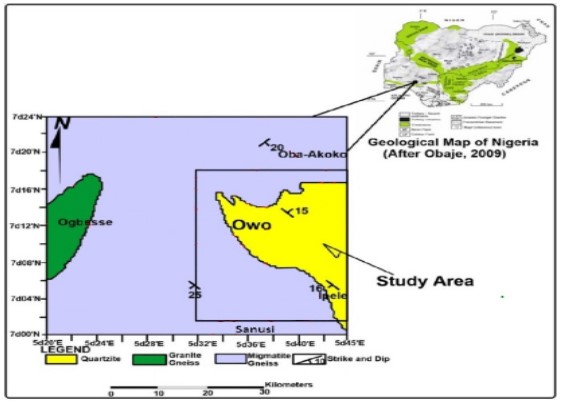
Geology of the study area: The study area can be found within the Pan-African mobile belt between the West African and Congo Cratons12. Both sedimentary and crystalline rocks make up the Geology of Nigeria and occur in almost equal proportions. The migmatite gneissic-quartzite complex, which falls within the Archean to Early Proterozoic (2700-2000 Ma), is the Precambrian basement rock in Nigeria12. Other units include the schist belt, which is trending NE-SW and is highly conspicuous in the Western half of the country. Granitoid plutons, which are of the older granite suite (Late Proterozoic-Early Phanerozoic), are also dominant in this area12. Amphibolite, migmatite gneisses, granites, and pegmatites are the main lithologies in the Southwestern part of Nigeria. Schists, which are made up of biotite schist, quartzite schist, talc-tremolite schist, and muscovite schists, are the other important rock units in the area. There is an intrusion of crystalline rocks into these schistose rocks. The Liberian (Archaean) 2500-2750±25 Ma, the Eburnean orogeny (Early Proterozoic), 2000-2500 Ma, the Kibaran orogeny (MidProterozoic), 1100-2000 Ma, and the Pan-African Orogeny, 450-750 Ma are the fore major orogeny which the Southwestern Nigeria basement complex has undergone (Fig. 4). The primary structures have been completely erased within the basement complex by the action of tectonic forces. Tectonic faulting in the area is not quite apparent, and most of those seen have been traced from aerial photographs and images of satellites13. Photogeological methods were used to map out lineaments in the Okemesi Area. The Itawure fault was found to be the major lineament in the region, which passes through Itawure and Efon-Alaye. The trending of the lineament is E-W, which is found to be a transcurrent fault, which displaces the fold nose that gave rise to double plunging of the fold axis. The field work of Anifowose and Borode13 revealed that fractures in the area are mainly trending in the E-W direction, a few of them are in the ENE-WSW direction. The dominant rocks in the study area are schists, quartzite, and migmatite, which trend from ENE-WSW mainly. The schist and quartzite are mostly found in Ipele and Owo, while Ogbese, Uso-Owo, Oba-Akoko, Eporo, Emure-Owo, and Amurin-Owo are situated on migmatite. As 60% of the study area is covered by Migmatite gneiss and quartzite. Places that are predominantly granite are of low groundwater, while the majority of the wells in the area of moderate to high groundwater potential. Nevertheless, basement aquifers are found to occur at shallow depths and may be susceptible to contamination14,15.
Fieldwork, lab analysis, and data interpretation were all used in the study. Water sample collection, sample preparation, and in situ physical parameter assessment were all part of the fieldwork. Using a digital TDS/EC meter, in situ measurements were made of temperature, electrical conductivity (EC), pH, and Total Dissolved Solids (TDS).
Sampling and preparation: Sampling bottles were appropriately labeled before sample collection. The bottles were rinsed with the well water and sampled to prevent contamination. To avoid cross-contamination from wells that had already been analyzed, hands were cleaned using the sample water. To stop leaks, the bottle caps were also cleaned with the sample water and tightly sealed. To guarantee that all important information was captured, thorough documentation was kept throughout the sample-collecting process. Before laboratory studies, eight water samples were collected, chilled to stop flocculation and bacterial growth, and then delivered to the Akure laboratory within a day for examination.
Analysis: Calcium, magnesium, sodium, potassium, carbonate, bicarbonate, chloride, sulfate, and nitrate were the main elements inspected in this study. Except for the chloride ion, which was determined using the silver nitrate titrimetric method, the concentrations of the majority of the anions were determined using spectrophotometry. The spectrophotometer’s test manager chose the parameter to be studied. The samples to be analyzed were placed in two 10 mL sample cells, and one pillow of test parameters was placed in one of the cells and shaken. The samples will be left for a couple of minutes, depending on the parameter to be tested, e.g., 0, 5 and 10 min.
The spectrophotometer screen showed the test parameter concentration in milligrams per liter after the blank was put in the sample chamber to calibrate to zero and the second sample cell was put in the chamber. By titrating each water sample in a conical flask with silver nitrate (0.014N AgNO3) and adding two drops of potassium dichromate (K2CrO) indicator, chloride was determined using titrimetric techniques. The brownish hue of the solution is the endpoint. Alkalinity allowed for the determination of carbonate and bicarbonate. Cation concentrations were measured using the Flame Photometry technique. The flame photometer was calibrated using several established standards of the evaluated parameters after the sample was sucked into the flame via an inlet hose. The screen shows the concentrations of the parameters that were examined17.
RESULTS AND DISCUSSION
Table 1 displays the physicochemical parameters of the laboratory results of the sampled borehole water. Nitrate concentration ranged from 0.9 to 15.07 mg/L (Table 1), with an average concentration of 6.03 mg/L. The location with the highest concentration was SP3, whereas that with the lowest concentration was SP4. The suitable limit of nitrate is 50 mg/L1,4 (Table 1). From the results of nitrate concentration in the analyzed water samples, no sample was above 50 mg/L, which is the recommended value, implying that all sampled borehole water in the area is said to be non-contaminated with nitrate. Calcium concentration ranges from 0.773 to 3.301 mg/L, with an average concentration of 1.783 mg/L. The location with the highest concentration was SP7, whereas the location with the lowest concentration was SP2. This implies that all the sampled borehole water in the area is non-contaminated. Sodium concentration ranges from 0.773 to 1.573 mg/L (Table 1), with an average concentration of 1.007 mg/L. The location with the highest concentration was SP7, whereas the location with the lowest concentration was SP6. The suitable limit of sodium4,17 is 40 to 200 mg/L (Table 2). From the results of sodium concentration in the analyzed water samples, no sample was above 200 mg L, implying that all sampled borehole water in the area is said to be non-contaminated with sodium. The Mg concentration ranged from 0.497 to 1.179 mg/L (Table 2), with an average concentration of 0.787 mg/L. The location with the highest concentration was SP3, whereas that with the lowest concentration was SP6. The suitable limit of sodium according to WHO4\pard f7 and SON18 was 20 mg/L (Table 2). From the results of the magnesium concentration in the analyzed water samples, there are zero samples above 20 mg/L, which implies that all sampled borehole water in the area is said to be non-contaminated with magnesium. Potassium concentration ranged from 0.769 to 1.035 mg/L (Table 1), with an average concentration of 0.114 mg/L. The location with the highest concentration is SP8 (Health Center borehole), whereas the location with the lowest concentration is SP6, which implies that all sampled borehole water in the area is said to be non-contaminated with potassium. The pH concentration ranged from 5.78 to 7.35 mg/L, with an average concentration of 6.49 mg/L (Table 1). The location with the highest pH concentration was SP1, whereas that with the lowest pH concentration was SP2. The suitable limit of pH4,17 is 6.5 to 8.8 (Table 1). From the result of the pH concentration, sample SP2 is below the SON and WHO standards, which implies that 12.5% of the sampled boreholes are said to be contaminated with low pH levels. The total dissolved concentration ranged from 72 to 224 mg/L, with an average concentration of 126.87 mg/L (Table 1). The location with the highest total dissolved solid concentration was SP7, whereas the location with the lowest total dissolved solid concentration was SP8. The suitable limit for the total dissolved solids is 500 mg/L (Table 1). From the results below, the total dissolved solid concentration in the analyzed water sample is zero samples above 500 mg/L, implying that all sampled borehole water in the area is said to be non-contaminated with total dissolved solids. Electrical conductivity ranged from 29 to 456 (μS/cm) (Table 1). The location with the highest electrical conductivity was SP9, while the location with the lowest electrical conductivity was SP3 (Table 1), which implies that all sampled borehole water in the area is non-contaminated.
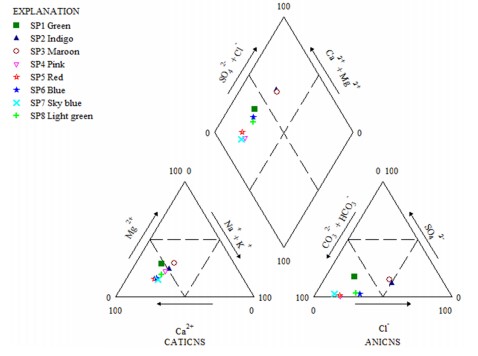
Pipers plot: The Piper diagram is based on the idea that the concentrations of cations and anions in water are such that the dissolved salts are electroneutral or that the total sum of the electric charges of the cations and anions equals zero19-22. A Piper diagram is a graphical picture of the chemical composition of one or more water samples. Although the Piper diagram does not lend itself to spatial comparisons, it is appropriate for comparing the ionic content of a set of water samples22.
| Table 1: | Well inventory and physical and chemical parameters of groundwater samples in Achievers University | |||
| Sample number |
Elevation (m) |
TDS (mg/L) |
Temp (°C) |
E/C (μS/cm) |
pH | Chloride (mg/L) |
Sulphate (mg/L) |
Nitrate (mg/L) |
Bicarbonate (mg/L) |
Carbonate (mg/L) |
| SP1 | 335 | 138 | 27.6 | 281 | 7.35 | 11.34 | 12.9 | 12.65 | 58 | ND |
| SP2 | 329 | 112 | 28.4 | 229 | 5.78 | 19.02 | 6.04 | 5.23 | 24 | ND |
| SP3 | 330 | 145 | 27.2 | 29 | 6.21 | 30.73 | 13.29 | 15.07 | 42 | ND |
| SP4 | 332 | 134 | 27 | 273 | 6.76 | 10.97 | 0.57 | 0.97 | 79 | ND |
| SP5 | 327 | 106 | 27.9 | 211 | 6.42 | 7.68 | 0.57 | ND | 56.5 | ND |
| SP6 | 315 | 84 | 29.6 | 154 | 6.38 | 11.34 | 1.14 | ND | 40 | ND |
| SP7 | 335 | 224 | 28.1 | 456 | 691 | 10.68 | 2.29 | ND | 108 | ND |
| SP8 | 334 | 72 | 28.3 | 144 | 6.17 | 11.04 | 1.71 | 14.17 | 44 | ND |
| WHO4 | *NHC | *NHC | 50 | 100 | *NHC | |||||
| SON18 | 250 | 100 | 50 | - |
| Table 2: | Cations of groundwater samples in Achievers University | |||
| Sample number | Calcium (mg/L) | Sodium (mg/L) | Magnesium (mg/L) | Potassium (mg/L) |
| SP1 | 3.301 | 0.829 | 1.082 | 0.912 |
| SP2 | 2.46 | 0.942 | 0.726 | 0.954 |
| SP3 | 2.831 | 1.573 | 1.179 | 0.957 |
| SP4 | 2.665 | 0.917 | 0.701 | 0.94 |
| SP5 | 3.595 | 0.782 | 0.516 | 0.865 |
| SP6 | 3.098 | 0.773 | 0.497 | 0.769 |
| SP7 | 5.805 | 1.195 | 0.865 | 0.907 |
| SP8 | 3.527 | 1.045 | 0.734 | 1.035 |
| WHO4 | - | 200 | 250-300 | *NHC |
| SON18 | - | 200 | - | - |
| *NHC: Not of health concern at levels found in natural water | ||||
|
|
Hydrochemical facies can be used to classify the water samples displayed on the Piper diagram. The diagram is centred on the dominating cation(s) or anion(s). According to Fig. 5, the cation represents the relative proportions of major cations such as calcium (Ca2+), magnesium (Mg2+), and sodium plus potassium (Na++K+). Each corner of the triangle corresponds to 100% of one of the cations, and the position within the triangle indicates the relative percentages.
The anions represent the relative proportions of major anions such as chloride (Cl–), sulfate (SO42–), and bicarbonate plus carbonate (HCO3–+CO32–). It’s similar to the cation diagram, each corner represents 100% of one anion.
The Piper plot indicates that all the water samples are magnesium bicarbonate type, calcium type, and bicarbonate type. Only two samples, SP2 and SP3, fall under no dominant type. All the water samples fall under the water facies of Alkaline earth. Magnesium, sodium, and bicarbonate enrichment in groundwater are usually attributed to the dissolution of aluminosilicate minerals of mostly feldspar23.
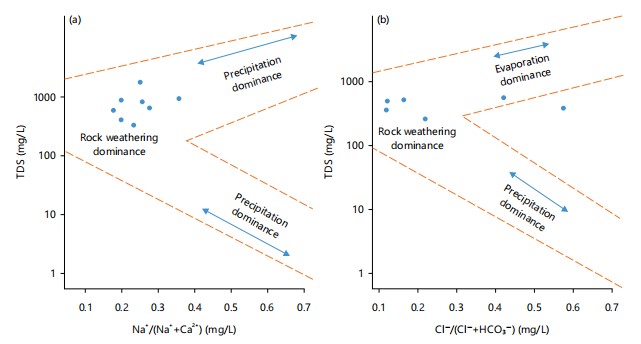
The Gibbs Plot shows the water chemistry and hydrogeochemical facies of the study area. All the water samples can be categorized as rock-weathering dominance in the cationic chemical facies. This shows that rock weathering contributes to the chemical constituent of the groundwater in the study area (Fig. 6). In the ionic chemical facies majority of the groundwater is weathering dominance, while one sample is categorized as evaporation dominance. This also emphasizes the impact of the weathering of rocks on the groundwater.
CONCLUSION
The borehole water samples from the sampled locations were found to be generally safe for consumption, with most parameters within the acceptable limits set by WHO and SON. Samples SP1, SP3, SP4, SP5, SP6, SP7, and SP8 are the samples that are generally safe for consumption according to WHO and SON standards for drinking water. The only exception was the pH level for sample SP2, which was slightly below the acceptable range, indicating mild acidity. However, this does not pose a significant health risk. Regular monitoring and appropriate measures can ensure the continued safety and quality of borehole water.
SIGNIFICANCE STATEMENT
This study assessed the physicochemical quality of groundwater from boreholes in Achievers University, Owo, Nigeria, revealing that most parameters, including nitrate, chloride, sulfate, bicarbonate, calcium, sodium, magnesium, and potassium, confirmed to WHO and SON drinking water standards. However, one sample exhibited slightly acidic pH levels (5.78), necessitating minor corrective measures. Hydrochemical analysis indicated rock weathering as the primary influence on water chemistry, with groundwater predominantly classified as magnesium-bicarbonate type. The findings confirm that the borehole water is generally safe for consumption but recommend periodic monitoring to sustain water quality and prevent potential contamination.
ACKNOWLEDGMENT
We would like to thank Mr Ajayi of the Federal University of Technology Akure, Nigeria, for the assistance rendered in carrying out geotechnical analysis.
REFERENCES
- Kılıç, Z., 2020. The importance of water and conscious use of water. Int. J. Hydrol., 4: 239-241.
- Egberongbe, H.O., O.O. Bello, A.T. Solate and M.S. Sossou, 2012. Microbiological evaluation of stream water for domestic use in rural areas: A case study of Ijebu North Local Government, Ogun State. Nigeria. J. Nat. Sci. Eng. Technol., 11: 93-103.
- Rani, J., U.K. Sharma and D.N. Sharma, 2018. Role of adequate water intake in purification of body. Environ. Conserv. J., 19: 183-186.
- WHO, 2017. Guidelines for Drinking-Water Quality, 4th Edition, Incorporating the 1st Addendum. 4th Edn., World Health Organization, Geneva, Switzerland, ISBN: 978-92-4-154995-0, Pages: 631.
- Pointet, T., 2022. The United Nations World Water Development Report 2022 on groundwater, a synthesis. LHB, 108.
- Dehkordi, M.M., Z.P. Nodeh, K.S. Dehkordi, H. Salmanvandi, R.R. Khorjestan and M. Ghaffarzadeh, 2024. Soil, air, and water pollution from mining and industrial activities: Sources of pollution, environmental impacts, and prevention and control methods. Results Eng., 23.
- Ali, B., Anushka and A. Mishra, 2022. Effects of dissolved oxygen concentration on freshwater fish: A review. Int. J. Fish. Aquat. Stud., 10: 113-127.
- Adeyemi, A.I., 2020. Bacteriological and physicochemical quality of Borehole water used for drinking at Olusegun Agagu University of Science and Technology, Okitipupa, Nigeria. Int. J. Environ. Agric. Biotechnol., 5: 890-897.
- Adewumi, A.J. and Y.B. Anifowose, 2017. Hydrogeologic characterization of Owo and its environs using remote sensing and GIS. Appl. Water Sci., 7: 2987-3000.
- Akinkugbe, O.A. and A.S. Adedeji, 2023. Bacteriological analysis of water tanks in halls of residence at Achievers University, Owo, Ondo State, Nigeria. Ach. J. Sci. Res., 4: 19-26.
- Falowo, O.O. and E.G. Imeokparia, 2015. Hydrogeological studies for groundwater resource and its vulnerability to contamination in Owo, Southwestern Nigeria. Int. J. Sci. Res., 4: 1331-1344.
- Oyinloye, A.O., 2011. Geology and Geotectonic Setting of the Basement Complex Rocks in South Western Nigeria: Implications on Provenance and Evolution. In: Earth and Environmental Sciences, Dar, I.A. and M.A. Dar (Eds.). InTech, Lahore, Pakistan, ISBN:9789533074689, pp: 98-117.
- Anifowose, A.Y. and A.M. Borode, 2007. A photogeological study of the fold structure in Okemesi Area, Nigeria. J. Min. Geol., 43: 125-130.
- Akinwumiju, A.S. and M.O. Olorunfemi, 2018. A GIS-based aquifer vulnerability assessment in the basement complex terrain of Southwestern Nigeria. Sustainable Water Resour. Manage., 4: 715-734.
- Oyedele, A.A., O.S. Ayodele and O.F. Olabode, 2019. Groundwater quality assessment and characterization of shallow basement aquifers in parts of Ado Ekiti Metropolis, Southwestern Nigeria. SN Appl. Sci., 1.
- Obaje, N.G., 2009. Geology and Mineral Resources of Nigeria. 1st Edn., Springer, Berlin, Germany, ISBN-978-3-540-92685-6, Pages: 221.
- Shukla, M. and S. Arya, 2018. Determination of chloride ion (Cl-) concentration in Ganga river water by Mohr Method at Kanpur, India. Green Chem. Technol. Lett., 4: 06-08.
- SON, 2007. Nigerian Industrial Standard: Nigerian Standard for Drinking Water Quality. Standards Organization of Nigeria, Governing Council, Lagos, Abuja, Nigerian, Pages: 30.
- Magaji, J.Y. and T.A. Abimbola, 2020. Comparative analysis of water quality from different sources in Masaka, Nasarawa State, Nigeria. Aust. J. Sci. Technol., 4: 303-311.
- Akanbi, O.A., O.A. Falana and S. Gabriel, 2022. Hydrogeochemical study of shallow groundwater of Oyo Town Southwestern Nigeria. Ajayi Crowther J. Pure Appl. Sci., 1: 1-9.
- Piper, A.M., 1944. A graphic procedure in the geochemical interpretation of water-analyses. EOS Trans. Am. Geophys. Union, 25: 914-928.
- Peeters, L., 2014. A background color scheme for piper plots to spatially visualize hydrochemical patterns. Groundwater, 52: 2-6.
- Akanbi, O.A., 2018. Hydrogeological characterisation and prospect of basement Aquifers of Ibarapa Region, Southwestern Nigeria. Appl. Water Sci., 8.
How to Cite this paper?
APA-7 Style
Bewaji,
S., Falade,
A.O., Edema,
A.A., Adeyemo,
A. (2025). Physicochemical Assessment of Achievers University Groundwater, Owo, Southwestern Nigeria. Asian Journal of Emerging Research, 7(1), 24-33. https://doi.org/10.3923/ajer.2025.24.33
ACS Style
Bewaji,
S.; Falade,
A.O.; Edema,
A.A.; Adeyemo,
A. Physicochemical Assessment of Achievers University Groundwater, Owo, Southwestern Nigeria. Asian J. Emerg. Res 2025, 7, 24-33. https://doi.org/10.3923/ajer.2025.24.33
AMA Style
Bewaji
S, Falade
AO, Edema
AA, Adeyemo
A. Physicochemical Assessment of Achievers University Groundwater, Owo, Southwestern Nigeria. Asian Journal of Emerging Research. 2025; 7(1): 24-33. https://doi.org/10.3923/ajer.2025.24.33
Chicago/Turabian Style
Bewaji, Seun, Ayodele Oluwasegun Falade, Ayodeji Abayomi Edema, and Abdullai Adeyemo.
2025. "Physicochemical Assessment of Achievers University Groundwater, Owo, Southwestern Nigeria" Asian Journal of Emerging Research 7, no. 1: 24-33. https://doi.org/10.3923/ajer.2025.24.33

This work is licensed under a Creative Commons Attribution 4.0 International License.