
Impact of Open Dumpsites on Groundwater Quality along Old Ikare Road, Owo, Southwestern Nigeria
-
Seun Bewaji

Department of Geological Sciences, Achievers University, Owo, Nigeria
Ayodele Oluwasegun FaladeDepartment of Geological Sciences, Achievers University, Owo, Nigeria
Ayodeji Abayomi EdemaDepartment of Geological Sciences, Achievers University, Owo, Nigeria
Ogidi, Tope JamesNewland Polytechnics Ilorin, Nigeria
| Received 09 Mar, 2025 |
Accepted 10 May, 2025 |
Published 11 May, 2025 |
Background and Objective: Owo, a rapidly growing town in Southwestern Nigeria with a population exceeding 400,000, accommodates two tertiary institutions and a Federal Medical Center. Disposing of medical and household waste in open dumpsites raises concerns about potential groundwater contamination via leachate. This study aims to evaluate the impact of leachate on groundwater quality by analyzing physicochemical parameters in well water samples collected near the dumpsite. Materials and Methods: Fifteen water samples were collected from wells near the dumpsite, and their physicochemical parameters were analyzed. The tested parameters included electrical conductivity (E/C), Total Dissolved Solids (TDS), pH, bicarbonate, nitrate, sulfate, chloride, potassium, magnesium, sodium, and calcium. The results were compared against the safe limits recommended by the Standards Organization of Nigeria (SON) and the World Health Organization (WHO). Results: The results showed that electrical conductivity ranged from 90.8 to 410 μS/cm, total dissolved solids from 29 to 321 mg/L, pH from 5.86 to 6.89, bicarbonate from 20 to 180 mg/L, nitrate from 0.05 to 30.43 mg/L, sulfate from 1.71 to 32.11 mg/L, chloride from 5.48 to 66.21 mg/L, potassium from 0.276 to 3.699 mg/L, magnesium from 0.35 to 2.16 mg/L, sodium from 0.79 to 3.19 mg/L, and calcium from 0.56 to 3.77 mg/L. All parameters were within SON and WHO safe limits. However, samples 14 and 15, closest to the dumpsite, exhibited the highest concentrations of most cations and anions, except for sodium. This indicates localized and progressive groundwater contamination. Calcium ions were dominant, forming an alkaline environment associated with rock weathering and bedrock dissolution within the aquifers. Weak acid presence was linked to anionic facies like bicarbonate, originating from carbon dioxide dissolution in the atmosphere and soil zone. Conclusion: Groundwater near the dumpsite exhibits localized contamination due to leachate infiltration. Despite this, the water quality index suggests that the water remains fit for drinking. Continued monitoring and improved waste management are recommended to prevent further contamination.
INTRODUCTION
Groundwater is very important for supporting life on Earth and is used for numerous purposes around the world, such as drinking and irrigation. Around 2.5 billion people rely on groundwater daily1. Groundwater is the main domestic water supply in Nigeria. It has been established that it is crucial for plantations. Although the potential health risk from drinking groundwater has been evaluated2. Unwanted residual materials created by human activities on Earth can become waste if not recycled, which leads to pollution when released into a water body. This waste may include items like sewage, household trash, and other industrial waste products. Waste products exist in solid, liquid, or even gaseous form, though groundwater is mainly polluted by solid waste dumping. According to a study, solid waste can be domestic, agricultural, or hazardous, and it can be biodegradable or non-biodegradable3. Biodegradable waste can decompose with the help of microbes producing leachate, while non-biodegradable waste can persist for a long time. However, leachate formed from decomposed waste can seep into the base of landfills, leading to pollution in urban and rural areas in Nigeria. Ondo State, like many other states in the country, faces waste management challenges. Heavy metals in the environment are a concern. Also, there is a need for ongoing monitoring. Dumping sites without proper management are a health risk, particularly in developing countries. The increase in waste generation poses environmental and health hazards, especially in communities near dumpsites. The disposal of industrial and medical waste alongside domestic waste poses an infection risk, and a dumpsite that can pose a problem to the community should be relocated to another area outside the residential area4. Therefore, this study on the old Ikare road in Ondo State aims to evaluate the influence and effect of landfill leachate on the surrounding environment and human settlements. The research location in Owo faces significant challenges related to waste management, particularly medical waste generated by the Federal Medical Center and deposited at the local dump site openly. The research study aimed to compare the quality of groundwater in the vicinity of this dump site with both local and international standards to identify potential interactions between leachates and the groundwater.
MATERIALS AND METHODS
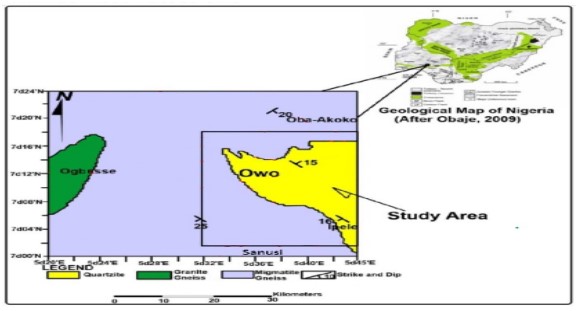
Geology of the study area: The study was carried out in Owo, Southwestern Nigeria, on March, 2024, which was the beginning of the rainy. The study area is located within the Pan-African mobile belt, situated between the West African and Congo cratons5,6. The region is characterized by Precambrian basement rocks, primarily composed of migmatite gneissic-quartzite complexes dating back to the Archean to Early Proterozoic (2700-2000 Ma)5. These rocks form the basement complex, which is the most prevalent unit in the Nigerian basement7. Additional geological units include Late Proterozoic to Early Phanerozoic (750-450 Ma) granitoid plutons of the older granite suite and NE-SW trending schist belts, mainly found in the Western part of Nigeria. The area has undergone several orogeneses, including the Liberian (Archaean, 2500-2750 Ma), Eburnean (Early Proterozoic, 2000-2500 Ma), Kibaran (Mid-Proterozoic, 1100-2000 Ma), and Pan-African (450-750 Ma). Tectonic activity has disrupted the principal structures within the basement complex, with major faults identified through satellite imagery and aerial photography5. The Itawure fault, a transcurrent fault trending E-W, is a significant structural feature, causing a double plunge in the fold axis. Fractures in the area predominantly trend E-W, with fewer in the ENE-WSW direction, as observed by Anifowose and Borode8, during their field trip. The dominant rock types in the area are migmatite, granite quartzite, and schists. Migmatite gneiss covers over 60% of the area, followed by quartzite5. Granite is predicted to have low groundwater potential, while quartzite is expected to have higher groundwater potential. Most wells in the study area are located in zones with moderate to high groundwater potential, with a third situated in areas with low potential. Many wells are also located on or near fracture zones. Geomorphologically, the region features valley plains, pediments, and hills. Field observations reveal newly developed outcrops with smooth surfaces showing minimal erosion. These outcrops contain small vein intrusions of quartz, aplite, and pegmatite. Common minerals include orthopyroxene, quartz, plagioclase, clinopyroxene, alkali feldspar, hornblende, and biotite, with accessory minerals such as zircon, apatite, and iron ores5.
|
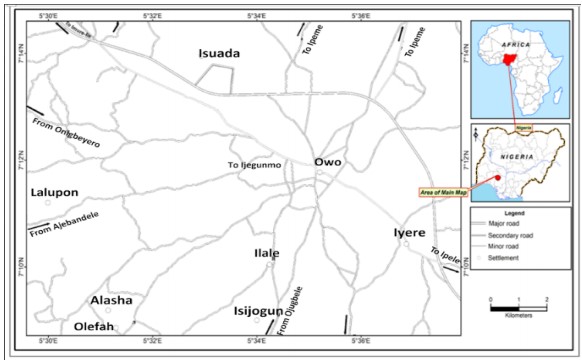
Location and accessibility of the area: The location for this study is around a dumpsite in Old Ikare Road, Owo, Southwestern Nigeria. Owo is situated at an intersection of roads from Akure, Kabba, Benin City, and Siluko. The notable establishment of the Federal Medical Center, the State Polytechnic, and the Achievers University have all contributed to the growth in population in Owo. There are various towns and villages around Owo, like Isuada, Ipeme, Uso, Iyere, Isijogun, and Ipele. All these are made up of Owo Kingdom (Fig. 1).
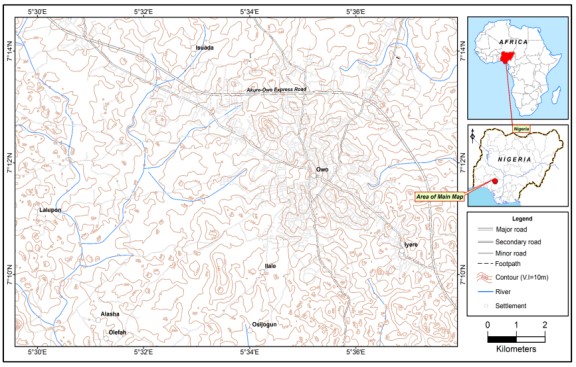
Topography and drainage of the study area: The topography of the study area is high (about 1200 m above sea level), which causes the ridges noted while participating in the fieldwork (Fig. 2). The study area is typically controlled geomorphologically due to its dendritic drainage pattern (Fig. 3)8-10. The major rivers in the region are the Aisewen, Iporo, and Ubeze. These rivers run throughout the year, and their streams are mainly seasonal, reaching the peak of dryness at the climax of the dry season. The majority of these large rivers have a perennial character, whereas their tributaries are primarily seasonal, reaching their greatest dryness during the climax of the dry season. The research location is situated in Nigeria’s Tropical Savannah Zone. The wet season, which is between March and September, and the dry season, which is between October and February, are its two main climates. The research area has a temperature range of 12.8 to 42.7°C. The research area experiences annual precipitation between 900 and 1800 mm11.
The study employed a combination of fieldwork, laboratory analysis, and evaluation of data. The fieldwork entailed the collection of water samples, sample preparation, and in situ measurement of physical parameters, which include: pH, Total Dissolved Solids (TDS), electrical conductivity (EC), and temperature using a digital TDS/EC meter.
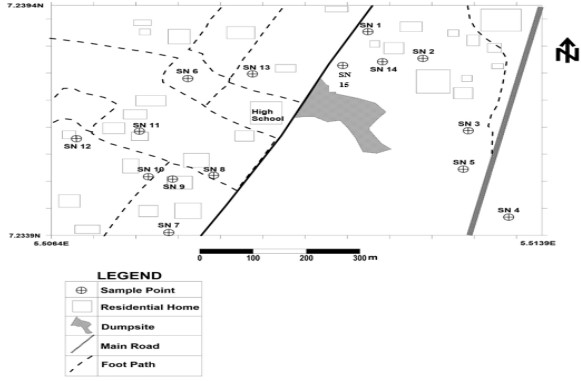
Sampling and preparation: Fifteen samples were collected from various wells around the dump site (Fig. 4). Before collecting samples, sampling bottles were properly labelled. To avoid contamination, the sample bottles were washed thoroughly with the same well water that was being sampled. Hands were washed with the sample water to prevent cross-contamination from previously sampled wells. The bottle caps were also rinsed with the sample water and securely closed to prevent leakage. Detailed documentation during sample collection was maintained to ensure all vital information was recorded. The structural characteristics of the wells, such as whether they were cased or uncased, were also noted. Fifteen water samples were taken and iced to inhibit flocculation and bacteria propagation before they were analyzed in the laboratory and then transported to the laboratory in Akure within 24 hrs for analysis.
|
|
Analysis
The major elements that were analyzed are potassium, magnesium, sodium, calcium, nitrate, chloride, sulphate, bicarbonate, and carbonate. The silver nitrate titrimetric method was used to know the chloride ion concentration (Table 1), and the spectrophotometry method was used to know the concentrations of most anions. The test manager of the spectrophotometer was employed to pick out the parameters for analysis. Two 10 mL–1 sample cells were filled with the samples to be tested, and 1 pillow of test parameter was added to one of the samples in the sample cell and was shaken. The reaction time of the test parameter was in the interval of 0, 5, and 10 min. The blank was then put in the sample chamber to read to zero, then the second sample cell was put in the chamber, and the concentration of the test parameter in mg/L was read on the spectrophotometer screen. While titrating silver nitrate (0.014N AgNO3) with two droplets of potassium dichromate (K2CrO) to serve as an indicator in the conical flask, the chloride in the sample is determined. The solution eventually turns to a brownish coloration, which is the end of titration. The alkalinity test was used to determine the carbonate and bicarbonate in the samples. The concentration of the cations was determined using the Flame Photometry method13.
| Table 1: | Well inventory and the analyzed major ion concentrations | |||
| Sample number | D/W (M) | pH | TEMP (°C) | TDS (PPM) | E/C (μS/cm) | Elevation (M) | Well description |
| SN1 | 20 m | 6.7 | 28 | 321 | 155 | 267 | Cased |
| SN2 | 21 m | 6.5 | 28.4 | 139 | 275 | 295 | Cased |
| SN3 | >20 m | 6.63 | 29.5 | 197 | 410 | 274 | Cased |
| SN4 | 10 m | 6.75 | 27.5 | 145 | 289 | 279 | Not cased |
| SN5 | 5 m | 6.53 | 27 | 173 | 397 | 218 | Cased |
| SN6 | >20 m | 6.89 | 28.3 | 80 | 152 | 281 | Cased |
| SN7 | >20 m | 6 | 28.6 | 82 | 166 | 292 | Cased |
| SN8 | >20 m | 6.35 | 29.1 | 78 | 156 | 284 | Cased |
| SN9 | 10 m | 6.28 | 29 | 90 | 180 | 280 | Cased |
| SN10 | 12 m | 6.21 | 29.8 | 89 | 174 | 287 | Cased |
| SN11 | >20 | 6.1 | 28.8 | 97 | 196 | 284 | Cased |
| SN12 | >20 m | 5.9 | 30 | 29 | 118 | 293 | Cased |
| SN13 | 14 m | 5.86 | 30.5 | 143 | 285 | 297 | Cased |
| SN14 | >20 | 6.6 | 28.3 | 45 | 90.8 | 277 | Cased |
| SN15 | >20 | 6.6 | 30 | 45 | 90.8 | 277 | Cased |
| WHO14,15 | - | 600 | 1500 | ||||
| SON16 | 6.5-8.5 | 600 | 1000-1500 |
|
RESULTS AND DISCUSSION
The readings for chemical constituents such as chloride, sulfate, nitrate, and bicarbonate ions in compared with the World Health Organization (WHO) and the Standard Organization of Nigeria (Table 2). The results of chloride concentration shown in Table 2, recorded across all 15 samples in the study area, show that the water may be safe for consumption according to WHO14,15 and SON16. The highest value of chloride concentration recorded is 66.2178 mg/L at location 15 (Old Ikare Road), while the lowest value of chloride concentration recorded is 5.4877 mg/L at location 6 (other side of the dumpsite).
The acceptable amount of nitrate concentration that can be found in water suitable for drinking, according to the WHO and SON, is 50 mg/L. No sample has a value of nitrate value above 50 mg/L, which means it is suitable for drinking, agriculture, and other industrial uses. The highest value recorded for nitrate concentration is 30.43 mg/L in location 14 (beside Ohore), while the minimum value is 1.57 mg/L in location 6 (other side of the dumpsite) (Table 2). The result of potassium concentration recorded in Table 2 shows that the value of potassium found across all samples is within the range of 0.276 to 3.699 mg/L. The highest value of potassium concentration is 3.699 mg/L at location 14 (beside Ohore), and the lowest value is at location 4 with a value of 0.276 mg/L (New Ikare Road). This means that the water is not contaminated with potassium. The concentration of magnesium recorded in Table 2 shows the value of magnesium found in the obtained samples is within the range of 0.350 to 2.160 mg/L. The acceptable concentration for magnesium is 20 mg/L according to the World Health Organization, and all values recorded are within the range of 20 mg/L, which means it’s not contaminated. Moreover, the maximum value of magnesium across all samples is 2.160 mg/L at location 14 (beside Ohore); meanwhile, the minimum value of 0.350 mg/L is at location 10 (old Ikare Ogunsusi), which shows that the area has not been contaminated with magnesium. The recorded value of sodium concentration recorded in Table 2 shows the samples are within the range of 0.790 to 3.199 mg/L. The highest value of sodium concentration recorded is 3.199 mg/L (Old Ikare, location 4), and the minimum value is 0.790 mg/L (Old Ikare Ogunsusi), however, the standard for the World Health Organization is below 200, which proves that the area isn’t contaminated with sodium. The calcium concentration recorded across all sample locations is between the range of 0.562-3.774 mg/L. The maximum value of calcium in all samples is 3.774 mg/L, while the minimum value is 0.56 mg/L, which implies there is no contaminant in the area of study.
| Table 2: | Chemical constituents (cations and anions) in the groundwater compared to WHO and SON | |||
| Sample | Ca2+ (mg/L) |
Na+ (mg/L) |
Mg2+ (mg/L) |
K+ (mg/L) |
Chloride (mg/L) |
Sulphate (mg/L) |
Nitrate (mg/L) |
Bicarbonate (mg/L) |
Carbonate (mg/L) |
| SN1 | 0.678 | 1.879 | 0.603 | 0.641 | 29.26 | 12.37 | 5.24 | 72 | ND |
| SN2 | 1.334 | 1.359 | 0.637 | 0.373 | 10.97 | 9.14 | ND | 81 | ND |
| SN3 | 1.933 | 1.597 | 1.385 | 0.278 | 7.316 | 1.71 | 2.08 | 95 | ND |
| SN4 | 0.562 | 3.199 | 0.35 | 0.276 | 11.7 | 23.43 | 0.05 | 70 | ND |
| SN5 | 1.678 | 1.887 | 0.821 | 0.695 | 47.55 | 25.52 | 21.31 | 60 | ND |
| SN6 | 1.085 | 1.088 | 0.654 | 0.544 | 5.487 | 7.43 | 1.57 | 34 | ND |
| SN7 | 0.996 | 1.128 | 0.603 | 0.548 | 7.316 | 6.86 | ND | 36 | ND |
| SN8 | 1.027 | 0.961 | - | - | 16.46 | 5.91 | 7.16 | 20 | ND |
| SN9 | 1.113 | 1.161 | 0.587 | 0.732 | 14.63 | 9.71 | 11.05 | 24.5 | ND |
| SN10 | 0.93 | 1.145 | 0.465 | 0.685 | 12.07 | 10.29 | 11.95 | 31.08 | ND |
| SN11 | 1.522 | 1.082 | 0.589 | 0.732 | 10.24 | 8.57 | 8.59 | 29.45 | ND |
| SN12 | 3.139 | 0.79 | 0.833 | 1.17 | 10.97 | 11.43 | 5.76 | 22.4 | ND |
| SN13 | 1.511 | 1.254 | 0.924 | 0.908 | 40.24 | 12.57 | 18.19 | 29.5 | ND |
| SN14 | 3.699 | 2.046 | 2.16 | 3.699 | 65.85 | 30.64 | 30.43 | 180 | ND |
| SN15 | 3.774 | 1.773 | 1.596 | 3.272 | 66.21 | 32.11 | 29.85 | 164 | c |
| WHO14,15 | - | 200 | 250-300 | *NHC | *NHC | *NHC | 50 | 100 | *NHC |
| SON16 | - | 200 | - | - | 250 | 100 | 50 | - | |
| *NHC Not of health concern at levels found in natural water and ND: Not detected | |||||||||
|
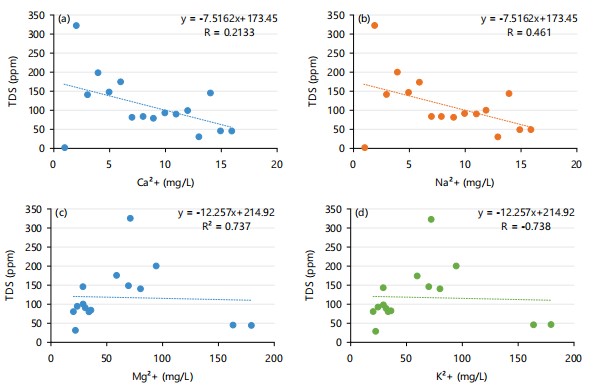
Relationship between cross plot TDS and metals: The metals concentration relationship is presented in the cross plot (Fig. 5). Figure 5a represents the relationship between TDS and calcium. The cross-plot value is negative, and the negative value implies that the source of contamination of the TDS and calcium is different. Figure 5b shows the relationship between the source of contamination of TDS and sodium to be negative, and it implies that they have different sources of contamination. Figure 5c indicates the relationship between the source of contamination of TDS and magnesium, which is also negative, and implies differences in the source of contamination. Figure 5d shows the relationship between the source of contamination of TDS and potassium. The negative sign shows the difference in the source of contamination of TDS and potassium.
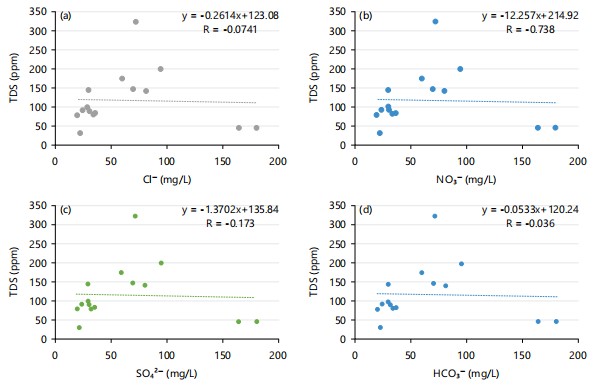
Relationship between cross plot TDS and non-metals: The cross plot of TDS and non-metals represents the relationship between TDS and non-metals (Fig. 6). Figure 6a represents the relationship between TDS and chloride, which is a very low negative value. The very low value is an indication that the sources of contaminate of TDS and chloride contamination are slightly different. Figure 6b shows the relationship of TDS with nitrate. The negative value shows a large difference in the source of contamination of TDS and nitrate. Figure 6c represents the relationship between TDS and sulphate, which is low and reveals differences in the source of contamination. Figure 6d represents the relationship between the source of contamination of carbonate and TDS, which is low negative value. It indicates a slight difference in the source of contamination.
|
Negative value implies their source of contamination is different, and the positive value implies their source of contamination is the same
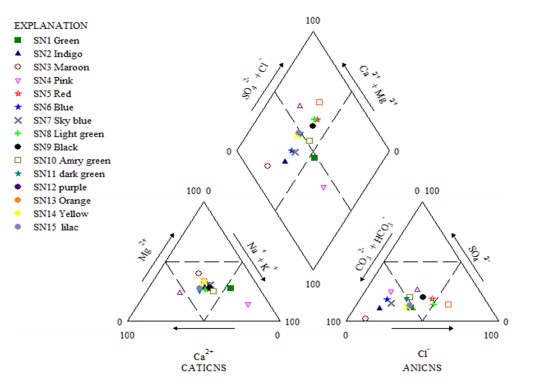
Pipers plot and hydrochemical facies: Two distinct ternary plots represent the cations and anions, respectively. The cations of calcium, magnesium, sodium, and potassium are the apexes of the cation plot. The sulfate, chloride, bicarbonate, and carbonate anions are near the apex of the anion plot. After that, a diamond is projected with the two ternary plots. A collection of water samples' ionic compositions is compared using a Piper diagram17-19. The Piper’s diagram is suitable for assessing water quality, providing insights into understanding the hydrogeological facies, monitoring changes in the water chemistry, as well as identifying contaminants over time. With relevance to the diagram shown in Fig. 6, a visual representation of the Piper’s plot is used to display the hydrogeochemistry of the water samples (Old Ikare Road). The ternary plot on the left side displays the cations of calcium, sodium, magnesium, and potassium. Similarly, on the left side of the ternary plot, sulphate, chloride, carbonate, and bicarbonate anions are displayed. The diamond-shaped plot visualizes information from both plots, providing insight into the water chemistry and classifying the different water samples in the study area. As seen in Fig. 7, the cations are under the category of “no dominant type”. Only one sample (SN2) is a “calcium type” while two other samples (SN1 and SN4) are in the category of “sodium and potassium type”. Furthermore, in Fig. 7, Most of the sample ions are the “bicarbonate type” while five samples (SN2, SN5, SN8, SN9, and SN10) are “no dominant type”. In addition, to the already interpreted ternary plot of the cation and anion respectively, the diamond plot in (Fig. 7) six samples (SN2, SN3, SN6, SN7, SN14, and SN15) are “calcium bicarbonate water” while samples (SN5, SN9, SN10, SN11, and SN12) are, only two water sample (SN1 and SN4) are “sodium bicarbonate water”. As 78% of the samples are alkaline earth types, 54% can be grouped as weak acids, and 12% are alkalis types of the geochemical facies. Calcium dominance in the groundwater is associated with the breaking down of rock and the dissolution of the underlying bedrock. Also, the weak acid is associated with anionic facies such as bicarbonate and carbonate may be derived from the dissolution of carbon IV oxide in the atmosphere and along the soil zone20.
|
| Table 3: | Water quality index and their respective water type23 | |||
| Range | Types of water | Study area |
| <50 | Excellent | Nill |
| 50-100 | Good | 100% fall within the category |
| 100-200 | Poor | Nill |
| 200-300 | Very poor | Nill |
| >300 | Unsuitable for drinking | Nill |
Water quality index: The weighted arithmetic water quality index method categorizes water quality based on the degree of purity, using the most regularly measured water quality variables. Many scientists have extensively used this method21-23. The summary of the water quality index is represented in Table 3. Additionally, the results of the WQI obtained from the research area indicate that the water is suitable for drinking (Table 3).
CONCLUSION
This study evaluates the impact of leachate on groundwater quality by physicochemical parameters in well water samples collected near the dumpsite. The results of physical and main ions parameters were within the permissible boundary suggested by the WHO and the SON. Samples 14 and 15, which are the closest to the dumpsite, had the highest quantities of the majority of cations and anions. This suggests that leachate from the dumpsite is contaminating the groundwater locally and gradually. Although underground water contamination is not as fast as surface water, care must be taken to prevent further contamination of this area by indiscriminate waste dumping.
SIGNIFICANCE STATEMENT
This study assesses the impact of open dumpsites on groundwater quality in Owo, Southwestern Nigeria, where groundwater serves as a primary water source. While most samples meet WHO and SON standards, localized contamination near the dumpsite indicates leachate infiltration with elevated cation and anion concentrations. Hydrochemical analysis identifies calcium-bicarbonate as the dominant water type, reflecting bedrock dissolution. The Water Quality Index classifies samples as “good,” but geological fractures suggest a gradual contamination risk. The findings highlight the need for improved waste management, regular monitoring, and sustainable disposal practices to safeguard groundwater resources.
REFERENCES
- Mukherjee, I. and U.K. Singh, 2020. Delineation of groundwater potential zones in a drought-prone semi-arid region of east India using GIS and analytical hierarchical process techniques. CATENA, 194.
- Chen, Y.W., C.Y. Yang, C.F. Huang, D.Z. Hung, Y.M. Leung and S.H. Liu, 2009. Heavy metals, islet function and diabetes development. Islets, 1: 169-176.
- Adewole, A.T., 2009. Waste management towards sustainable development in Nigeria: A case study of Lagos State. Int. NGO J., 4: 173-179.
- Oyeku, O.T. and A.O. Eludoyin, 2010. Heavy metal contamination of groundwater resources in a Nigerian urban settlement. Afr. J. Environ. Sci. Technol., 4: 201-214.
- Oyinloye, A.O., 2011. Geology and Geotectonic Setting of the Basement Complex Rocks in South Western Nigeria: Implications on Provenance and Evolution. In: Earth and Environmental Sciences, Dar, I.A. and M.A. Dar (Eds.). InTech, Lahore, Pakistan, ISBN:9789533074689, pp: 98-117.
- Oyawale, A.A. and O.O. Ocan, 2020. Migmatization process and the nature of transition from amphibolite to granulite facies metamorphism in Ikare Area South Western Nigeria. J. Geol. Min. Res., 12: 45-64.
- Baba, S.A., S.I. Abaa and S.S. Dada, 2006. Preliminary petrogenetic study of some rocks from Gwoza area, NE Nigeria. Global J. Geol. Sci., 4: 147-155.
- Anifowose, A.Y. and A.M. Borode, 2007. A photogeological study of the fold structure in Okemesi Area, Nigeria. J. Min. Geol., 43: 125-130.
- Iloeje, N.P., 1981. A New Geography of Nigeria. Longman Schools Division, England, ISBN: 978-0582603967, Pages: 201.
- Adewumi, A.J. and Y.B. Anifowose, 2017. Hydrogeologic characterization of Owo and its environs using remote sensing and GIS. Appl. Water Sci., 7: 2987-3000.
- Falowo, O.O. and E.G. Imeokparia, 2015. Hydrogeological studies for groundwater resource and its vulnerability to contamination in Owo, Southwestern Nigeria. Int. J. Sci. Res., 4: 1331-1344.
- Obaje, N.G., 2009. Geology and Mineral Resources of Nigeria. 1st Edn., Springer, Berlin, Germany, ISBN-978-3-540-92685-6, Pages: 221.
- Shukla, M. and S. Arya, 2018. Determination of chloride ion (Cl-) concentration in Ganga river water by Mohr Method at Kanpur, India. Green Chem. Technol. Lett., 4: 06-08.
- WHO, 2017. Guidelines for Drinking-Water Quality, 4th Edition, Incorporating the 1st Addendum. 4th Edn., World Health Organization, Geneva, Switzerland, ISBN: 978-92-4-154995-0, Pages: 631.
- WHO, 2011. Guidelines for Drinking-Water Quality. 4th Edn., World Health Organization, Geneva, Switzerland, ISBN-13: 9789241548151, Pages: 564.
- SON, 2007. Nigerian Industrial Standard: Nigerian Standard for Drinking Water Quality. Standards Organization of Nigeria, Governing Council, Lagos, Abuja, Nigerian, Pages: 30.
- Magaji, J.Y. and T.A. Abimbola, 2020. Comparative analysis of water quality from different sources in Masaka, Nasarawa State, Nigeria. Aust. J. Sci. Technol., 4: 303-311.
- Akanbi, O.A., O.A. Falana and S. Gabriel, 2022. Hydrogeochemical study of shallow groundwater of Oyo Town Southwestern Nigeria. Ajayi Crowther J. Pure Appl. Sci., 1: 1-9.
- Piper, A.M., 1944. A graphic procedure in the geochemical interpretation of water-analyses. EOS Trans. Am. Geophys. Union, 25: 914-928.
- Akanbi, O.A., 2018. Hydrogeological characterisation and prospect of basement Aquifers of Ibarapa Region, Southwestern Nigeria. Appl. Water Sci., 8.
- Balan, I.N., M. Shivakumar and P.D.M. Kumar, 2012. An assessment of groundwater quality using water quality index in Chennai, Tamil Nadu, India. Drug Dev. Ther., 3: 146-150.
- Chauhan, A. and S. Singh, 2010. Evaluation of Ganga water for drinking purpose by water quality index at Rishikesh, Uttarakhand, India. Rep. Opin., 2: 53-61.
- Bashir, N., R. Saeed, M. Afzaal, A. Ahmad and N. Muhammad et al., 2020. Water quality assessment of lower Jhelum canal in Pakistan by using geographic information system (GIS). Groundwater Sustainable Dev., 10.
How to Cite this paper?
APA-7 Style
Bewaji,
S., Falade,
A.O., Edema,
A.A., James,
O.T. (2025). Impact of Open Dumpsites on Groundwater Quality along Old Ikare Road, Owo, Southwestern Nigeria. Asian Journal of Emerging Research, 7(1), 14-23. https://doi.org/10.3923/ajer.2025.14.23
ACS Style
Bewaji,
S.; Falade,
A.O.; Edema,
A.A.; James,
O.T. Impact of Open Dumpsites on Groundwater Quality along Old Ikare Road, Owo, Southwestern Nigeria. Asian J. Emerg. Res 2025, 7, 14-23. https://doi.org/10.3923/ajer.2025.14.23
AMA Style
Bewaji
S, Falade
AO, Edema
AA, James
OT. Impact of Open Dumpsites on Groundwater Quality along Old Ikare Road, Owo, Southwestern Nigeria. Asian Journal of Emerging Research. 2025; 7(1): 14-23. https://doi.org/10.3923/ajer.2025.14.23
Chicago/Turabian Style
Bewaji, Seun, Ayodele Oluwasegun Falade, Ayodeji Abayomi Edema, and Ogidi, Tope James.
2025. "Impact of Open Dumpsites on Groundwater Quality along Old Ikare Road, Owo, Southwestern Nigeria" Asian Journal of Emerging Research 7, no. 1: 14-23. https://doi.org/10.3923/ajer.2025.14.23

This work is licensed under a Creative Commons Attribution 4.0 International License.