
Residual Oil Saturation Estimation Using the Generalized-Archie Parameters, “FAS”-Field, Niger Delta
| Received 09 Jan, 2025 |
Accepted 05 Feb, 2025 |
Published 06 Feb, 2025 |
Background and Objective: The estimation of residual oil saturation (Sor) in shaly sand hydrocarbon reservoirs has been a difficult task due to the non-linearity in reservoir properties. However, the study aimed to identify the deficiencies associated with estimating residual oil saturation from the generalized Archie petrophysical exponents and also provides the procedures for applying the conventional (Archie) method in Sor estimation, thereby facilitating easy automation. Materials and Methods: The study utilized well-log data obtained from the “FAS” Field, Offshore Niger Delta, to estimate Sor using the Archie method. The reliability of the method was tested statistically with Core Sor data from the study area. Results: The Sor ranged from 0.2 (FAS_06 and FAS_08) to 0.47 (FAS_03) in the delineated reservoirs (A and B). The percentage deviation of the estimated Sor concerning the core data varied from 51% (FAS_03) to 86% (FAS_02) within the field. It was inferred that the delineated reservoirs are generally dirty, having a high proportion of shale in them, which made the generalized Archie petrophysical exponents unreliable and inappropriate for the study area. Conclusion: It was therefore suggested that the conventional (Archie) method of computing field-based petrophysical exponents be automated, rather than using the commonly used petrophysical parameters, for an optimal residual oil saturation recovery in the study area.
INTRODUCTION
Exploring and developing hydrocarbons in uncharted or “virgin” fields often presents significant technical, financial, and temporal challenges. To address the ever-increasing global demand for energy, revisiting mature oil fields for additional hydrocarbon extraction has become a practical and economically viable approach. This strategy is essential for maximizing recovery from reservoirs that have undergone primary and secondary production stages. During the initial phases of reservoir production, only a limited proportion of the original oil in place (OOIP) is typically recovered, leaving a substantial volume of hydrocarbons trapped within the pore spaces of the reservoir rock. In waterflooded reservoirs, quantifying residual oil saturation (Sor) is critical for evaluating the reservoir’s economic feasibility and for planning Enhanced Oil Recovery (EOR) or tertiary recovery methods1.
Mohamad and Hamada2 classified methods for estimating Sor into laboratory-based and field-based approaches. Laboratory techniques include core analysis, core flooding, centrifugation, counter-current imbibition (CCI), and digital rock physics (DRP), while field-based techniques encompass well log analysis, tracer tests, and reservoir performance studies such as material balance calculations, pressure transient testing, and reservoir simulation. For example, Haley3 applied pulsed neutron capture logging technology in laminated formations.
The proportion of residual oil within a reservoir is closely tied to the wettability of the reservoir rock. Wettability influences fluid distribution and flow behavior in the pore network. It was established that Sor depends on the degree of waterflooding, which in turn is governed by wettability4.
Quantifying Sor in water-flooded reservoirs presents additional geological and petrophysical complexities. Resistivity-based methods face challenges in reservoirs with mixed salinity due to variations between the salinity of connate water and injected water. Furthermore, the imbibition process can alter saturation exponents, complicating estimations5. However, by integrating multiple methods, both laboratory and field-based, confidence in Sor assessments can be improved.
This study presents a systematic approach to estimating residual oil saturation (Sor) from well-log data using Archie’s equation6, along with its widely accepted petrophysical parameters (a = 1, m = 2, and n = 2). This approach serves as a foundational guide for researchers seeking to refine or automate this conventional method and apply it in reservoirs with similar geological and petrophysical conditions. The Archie equation has been a cornerstone in petrophysical evaluations, particularly for estimating water saturation and residual oil saturation in clean, sandstone reservoirs. However, its application often assumes certain conditions, such as negligible shale content and uniform wettability, which may not hold in all reservoirs. By explicitly outlining the steps for its use, this study bridges the gap between theory and practice.
MATERIALS AND METHODS
Geology of Niger Delta basin: The Niger Delta clastic wedge is a geological product of a triple junction system comprising the Gulf of Guinea, the South Atlantic Ocean, and the Benue Trough. Its formation dates back to the Late Jurassic and is associated with the failed arm of the triple junction, which emerged during the rifting and subsequent separation of the South American and African plates7,8. This basin has evolved into a 12 km thick clastic wedge, hosting the 12th largest accumulation of recoverable hydrocarbons globally, with reserves exceeding 34 billion barrels of oil and 93 trillion cubic feet of gas9.
Hydrocarbons are formed at great depths from the remains of dead plants and animals within oceanic or aquatic environments. Although the exact mechanisms involved are not entirely understood, it is widely believed that hydrocarbons originate from organic material deposited at the base of aquatic environments, typically in seas but occasionally in rivers, lakes, coral reefs, or algal mats. The primary constituents of these organisms include proteins, carbohydrates, and lipids9.
As the burial of this organic matter continues, additional sedimentary debris accumulates, further overlying the organic material. Anaerobic decomposition by bacteria then breaks down the material into humic and fulvic complexes9. The humic complex includes kerogen, which is a general term used to describe the intermediate products obtained from the decomposition of the initial organic sediments. This process of organic matter degradation into humic and fulvic complexes is referred to as diagenesis.
The Tertiary section of the Niger Delta is characterized by three major stratigraphic formations, each representing distinct depositional environments and facies transitions. These formations are defined primarily by their sand-shale ratios and depositional processes.
The Akata Formation is located at the base of the deltaic sequence, the Akata Formation consists predominantly of thick marine shale sequences, which serve as potential source rocks. It also contains turbidite sands, representing deepwater reservoirs, along with minor clay and silt. This formation, deposited from the Paleocene to the Recent, developed during low-stand system tracts when terrestrial organic material and clays were transported to deepwater environments characterized by low energy and oxygen-deficient conditions10. The Akata Formation underlies the entire delta and is typically over-pressured. Turbidity currents likely deposited deep-sea fan sands in the upper parts of this formation during deltaic development8.
Overlying the Akata Formation is the Agbada Formation, it represents the deltaic portion of the sedimentary sequence. Its deposition began in the Eocene and continues to the Recent. The formation is predominantly composed of paralic siliciclastic sediments and is more than 3700 m thick. The lower portion features an interbedding of sandstone and shale in approximately equal proportions, representing alternating depositional environments of deltaic and shallow marine influences. The upper Agbada Formation is dominated by sand with minor shale intercalations, reflecting more proximal deltaic conditions. This formation is the primary petroleum-bearing unit of the delta and is critical for its hydrocarbon productivity.
The youngest of the three formations is the Benin Formation, it is composed of continental sediments deposited from the latest Eocene to the Recent. It comprises predominantly alluvial and upper coastal plain sands that are up to 2000 m thick. These deposits reflect fluvial-dominated environments and are characterized by high porosity and permeability, making them significant for groundwater reservoirs but less relevant for hydrocarbon accumulation shown in Fig. 111.

|

|
Study area: The Niger Delta Basin is located in Southern Nigeria, between Latitudes 3°N and 6°N and Longitudes 5°E and 9°E13. The study area, known as the ‘’FAS’‘ Field, is situated in the Offshore region of the Niger Delta Basin. This field comprises eight wells drilled at varying distances, with core residual oil saturation (Sor) data obtained from three wells (FAS-01, FAS-02, and FAS-03), acquired between 19th December, 2000 and 10th March, 2006 (Fig. 2). The basin is bordered to the South by the Gulf of Guinea and to the North by older Cretaceous tectonic features, including the Anambra Basin, the Abakaliki Uplift, and the Afikpo Syncline.
Materials: The datasets used in this study comprised well logs and core data acquired between 2000 and 2006 (Fig. 2a-b). The well-log data included gamma ray, deep resistivity, density, and neutron measurements recorded from eight wells (FAS-01, FAS-02, FAS-03, FAS-04, FAS-05, FAS-06, FAS-07, and FAS-08). These datasets were employed to estimate the residual oil saturation (Sor) within the study area.
Core-derived Sor data were obtained from three wells (FAS-01, FAS-02, and FAS-03) and were used to validate the Sor estimates derived through the conventional method (Archie). This comparative approach ensures a higher degree of accuracy and reliability in the Sor estimation process, particularly in complex reservoir settings. The integration of core and well-log data also highlights the importance of cross-referencing multiple datasets to achieve robust interpretations of reservoir properties.
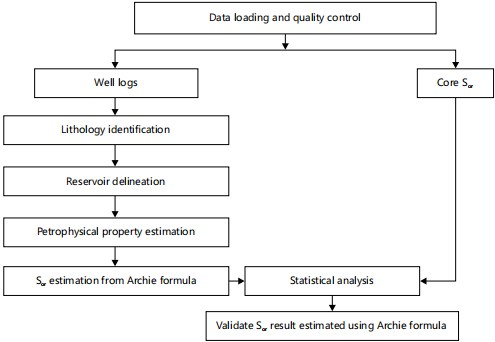
Methods: The workflow employed in this study is illustrated in Fig. 3. The first step involved data loading and quality control. The datasets (well logs and core data) were imported into Petrel software and corrected for any discrepancies that could compromise the accuracy of the results. Lithologies were identified, and reservoirs were delineated from the well-log data. To analyze the characteristics and composition of the reservoirs, petrophysical properties (volume of shale, total porosity, effective porosity, residual water saturation, and residual oil saturation) were estimated. Residual fluid saturation was calculated using Archie’s formula. Finally, the estimated residual oil saturation (Sor) values derived from the generalized petrophysical properties were statistically validated against the core Sor values.
Data loading and quality control: The well log and core data were imported into Petrel software for analysis and quality control. The data were examined for discrepancies or inconsistencies that could potentially impact the computation of residual oil saturation (Sor). The outliers or anomalous values that were identified were removed to ensure the integrity and reliability of the subsequent interpretations.
|
Lithology identification: Lithologies in the study area were identified using gamma ray log responses, which enabled differentiation between sandstone and shale formations. This was accomplished by establishing a shale cutoff value, a threshold used to distinguish sandy intervals from shaly zones. The cutoff value was derived by calculating the volume of shale (Vsh) using Eq. 1 and 215:
| (1) |
where, IGR is the gamma-ray index (fraction), GRlog is the gamma-ray log (API), GRmin is the gamma-ray minimum which indicates clean sand (API), and GRmax is the gamma-ray maximum which indicates shale (API). The volume of shale was calculated for a non-linear method using Eq. 215:
| (2) |
where, Vsh is the volume of shale (fraction).
The interpretation was further supported by analyzing the responses of neutron and density logs within the shale zones. Shales are expected to exhibit relatively higher density values due to their clay content and compaction, as well as a higher hydrogen index, resulting from their elevated bound water content. These combined log responses provided a robust framework for identifying and characterizing lithological variations within the reservoirs.
Reservoir delineation: Potential reservoirs within the field were identified by analyzing sand units with relatively high resistivity values, indicative of hydrocarbon presence. The process began by isolating clean sand intervals exhibiting very low resistivity, which suggested the presence of water. The true resistivity of the formation water was calculated using Archie’s equation6, providing a critical parameter for computing water saturation in the sand lithologies. This systematic approach ensured a reliable identification of reservoir-quality intervals and their hydrocarbon potential within the study area.
Petrophysical property evaluation: The delineated reservoirs were characterized using key petrophysical properties, including the volume of shale (Vsh) porosity, residual water saturation (Sxo), and residual oil saturation (Sor ). These parameters provided insights into the reservoir quality and its hydrocarbon storage and recovery potential.
Total porosity (фt ) was calculated from the density log using Eq. 3, which incorporates the matrix density (ρma), the density of the fluid content (ρfl), and the bulk density of the rock (ρb )16. This method enabled accurate estimation of porosity by accounting for variations in lithology and fluid properties. The computed porosity values, in combination with other petrophysical parameters, were instrumental in evaluating the reservoir’s capacity to store and produce hydrocarbons:
| (3) |
where, фt is the total porosity (fraction), ρma is the matrix density (g/cm3) (commonly used for sandstone = 2.65 g/cm3), ρb is the bulk density (g/cm3) (value of the density log in the interval of interest), and ρfl is the fluid (oil) density (g/cm3) from PVT data.
Effective porosity (фe ) was calculated using Eq. 4, which accounts for the influence of shale content on the reservoir’s pore space connectivity. This computation involved subtracting the volume of shale (Vsh ) from the total porosity (фt) to isolate the porosity associated with interconnected pore spaces within the reservoir rock16.
Shale, being a fine-grained material, often occupies pore spaces and disrupts the continuity of the reservoir’s effective pore network, thereby reducing its capacity to store and transmit hydrocarbons. By removing the shale contribution, the effective porosity provided a more accurate representation of the reservoir’s ability to facilitate fluid flow, making it a critical parameter in reservoir characterization and performance evaluation:
фe = фt×(1-Vsh) |
(4) |
where, фe is the effective porosity (fraction), фt is the total porosity, and Vsh is the volume of shale (fraction).
Residual water saturation was calculated using the Archie formula in Eq. 5. This was computed by considering the commonly used Archie parameters (a = 1, m = 2, and n = 2). The calculation incorporated resistivity values from well log data, along with the formation factor the mud filtrate resistivity, and the resistivity of the flushed zone6,16. By applying these parameters, the residual water saturation provided insights into the fraction of pore space occupied by water that remains immobile during hydrocarbon production. This value is critical for assessing reservoir quality and planning enhanced oil recovery strategies:
 |
(5) |
where, Sxo is the residual water saturation (fraction), a is the tortuosity exponent (unitless) Rmf is the resistivity of mud filtrate (Ωm), Rxo is the resistivity of the flushed zone or residual resistivity (Ωm), фt is the total porosity (fraction), m is the cementation factor (unitless), and n is the saturation exponent (unitless).
Residual oil saturation was also estimated from the Archie formula using Eq. 6. This calculation involved subtracting the residual water saturation (Sxo) from the total fluid content within the reservoir6:
Sor = 1-Sxo |
(6) |
where, Sor is the residual oil saturation (fraction) and Sxo is the residual water saturation.
Statistical analysis: The Archie method of estimating Sor was validated by considering the percentage mean deviation (d) of the computed Sor for the Core Sor from wells (FAS-01, FAS-02, and FAS-03) using Eq. 717:
| (7) |
where, 2 is the mean value of core Sor data, 1 is the mean value of the computed Sor.
RESULTS AND DISCUSSION
The analysis were presented in both tables and graphs for clarity and ease of interpretation. To assess the reliability of the conventional method (Archie), the percentage mean deviation between the estimated values of residual oil saturation (Sor) and the Core Sor data was calculated, providing a measure of the accuracy and consistency of the conventional method in the study area.
Figure 4 shows a histogram plot of the cumulative frequency of gamma ray log values against the radioactive occurrence or count rates in FAS-01. The plot identifies a sand line at 15.28 (API) and a shale line at 95.40 (API), which represent the key thresholds for differentiating sand and shale intervals. This plot forms the foundation for computing the volume of shale in the specified well. The sand and shale points identified across all the wells are summarized in Table 1, offering a comprehensive overview of lithological variations within the reservoir.
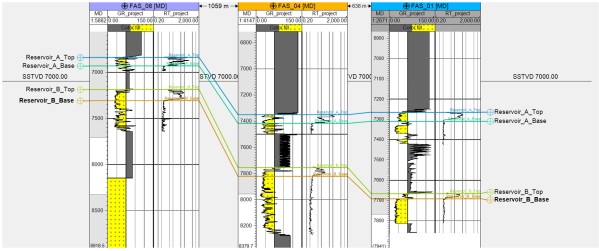
Figure 5 presents the lithostratigraphic correlation panel for wells (FAS-06, FAS-04, and FAS-01) at varying distances from each other. The correlated wells are located along the Southwest to Northeast of the “FAS” Field. The FAS-06 is drilled 1,059 m away from FAS-04, while FAS-01 is located 638 m away from FAS-04. The first well track of the well correlation panel is the gamma-ray log (denoted as GR project), with the radioactive elements (horizontal axis), plotted against depth (vertical axis) on a linear graph, scaled from 0-150 API. This plot helps to identify the different lithologies in the field. The two lithologies, sand and shale, were identified and correlated across the three wells (FAS-06, FAS-04, and FAS-01). Shales (denoted in gray) generally have relatively higher radioactive element concentrations compared to sandstone (denoted in yellow). Next to the gamma-ray log on the well correlation panel, the second well track is the resistivity log (denoted as RT project). It is a logarithmic graph scaled from 0.2-2,000 Ωm. The graph plots the deep resistivity log (horizontal axis) against depth (vertical axis), which helps to identify the different reservoir units in the field. Hydrocarbon sands were identified from the sand units that showed high resistivity values, while regions of sands and shales with relatively low resistivity values imply the presence of water12. The identified hydrocarbon reservoirs (A and B) were correlated across the field to determine their extent of deposition.

|
|
| Table 1: | Identified gamma ray values of shale and sand end points for all wells (FAS-01 to 08) | |||
| Well (unitless) | GR1 matrix (API2) | GR shale (API) | GR method (unitless) |
| “FAS”-01 | 15.0788 | 95.3113 | Stieber-variation II |
| “FAS”-02 | 8.88972 | 98.2371 | Stieber-variation II |
| “FAS”-03 | 15.3038 | 99.8125 | Stieber-variation II |
| “FAS”-04 | 9.00225 | 106.339 | Stieber-variation II |
| “FAS”-05 | 11.8155 | 98.012 | Stieber-variation II |
| “FAS”-06 | 15.0788 | 92.2731 | Stieber-variation II |
| “FAS”-07 | 8.88972 | 101.5 | Stieber-variation II |
| “FAS”-08 | 11.8155 | 98.1245 | Stieber-variation II |
| GR: Gamma-ray, API: American Petroleum Institute, it is the standard unit used to measure gamma rays | |||
Table 2 presents the petrophysical properties estimated for reservoirs (A and B) in the eight wells (FAS-01 to FAS-08).
In reservoir A, the gross thickness varied from 10.36 m (34 ft) in FAS-08 to 14.94 m (49 ft) in FAS-05. The volume of shale varied from 0.08 (8%) in FAS-01 to 0.18 (18%) in FAS-06. The total porosity is between 0.25 (25%) in FAS-05 and 0.30 (30%) in FAS-02, and the effective porosity ranged from 0.21 (21%) in FAS-05 to 0.26 (26%) in FAS-01 and FAS-02. Residual water saturation varied from 0.53 (53%) in FAS-03 to 0.98 (98%) in FAS-06 and FAS-08. Residual oil saturation ranged from 0.02 (2%) in wells (FAS-06 and FAS-08) to 0.47 (47%) in FAS-03.
| Table 2: | Petrophysical properties from the generalized Archie (1942) petrophysical exponents, across wells (01 to 08) | |||
| Well (“FAS”) | Reservoir (unitless) | Fluid (unitless) | Top (ft) | Bottom (ft) | Gross (ft) | Net (ft) | Vsh (%) | фt (%) | фe (%) | Sxo (%) | Sor (%) |
| 1 | A | Oil | 7267 | 7304 | 37 | 37 | 0.08 | 0.28 | 0.26 | 0.85 | 0.15 |
| 1 | B | Oil | 7664 | 7697 | 32.5 | 32 | 0.06 | 0.27 | 0.21 | 0.79 | 0.21 |
| 2 | A | Oil | 6648.5 | 6689 | 40.5 | 40.5 | 0.12 | 0.3 | 0.26 | 0.92 | 0.08 |
| 2 | B | Oil | 6950 | 7018 | 68 | 68 | 0.05 | 0.26 | 0.24 | 0.88 | 0.12 |
| 3 | A | Oil | 6679.5 | 6720 | 40.5 | 40.5 | 0.1 | 0.29 | 0.25 | 0.53 | 0.47 |
| 3 | B | Oil | 6988 | 7068 | 80 | 79.51 | 0.03 | 0.25 | 0.23 | 0.77 | 0.24 |
| 4 | A | Oil | 7369 | 7417 | 47.5 | 47.5 | 0.13 | 0.26 | 0.23 | 0.91 | 0.09 |
| 4 | B | Oil | 7750.5 | 7816 | 65.5 | 65 | 0.09 | 0.24 | 0.2 | 0.96 | 0.04 |
| 5 | A | Oil | 7631 | 7680 | 49 | 48 | 0.16 | 0.25 | 0.21 | 0.94 | 0.06 |
| 5 | B | Oil | 8113.5 | 8163 | 49.5 | 45 | 0.1 | 0.22 | 0.17 | 0.98 | 0.02 |
| 6 | A | Oil | 6889.5 | 6938 | 48.5 | 48.5 | 0.18 | 0.27 | 0.22 | 0.98 | 0.02 |
| 6 | B | Oil | 7186 | 7305 | 119 | 119 | 0.1 | 0.24 | 0.22 | 0.93 | 0.07 |
| 7 | A | Oil | 6653.5 | 6694 | 40.5 | 40.5 | 0.13 | 0.27 | 0.24 | 0.9 | 0.1 |
| 7 | B | Oil | 6944 | 7021 | 77 | 76.5 | 0.04 | 0.24 | 0.21 | 0.91 | 0.09 |
| 8 | A | Oil | 7340 | 7374 | 34 | 34 | 0.15 | 0.27 | 0.23 | 0.98 | 0.02 |
| 8 | B | Oil | 7696 | 7783 | 86.5 | 82 | 0.11 | 0.27 | 0.23 | 0.91 | 0.1 |
| Vsh: Volume of shale, фt: Total porosity, фe: Effective porosity, Sxo: Residual water saturation, Sor: Residual oil saturation and ft: feet | |||||||||||
| Table 3: | Percentage mean deviation of the computed Sor (Archie) with respect to the Core Sor | |||
| Well | Reservoir | Computed Sor (Archie) | Core Sor | Percentage of mean deviation of the computed Sor (Archie) with respect to the Core Sor values |
| “FAS”-01 | A | 0.15 | 0.47 | 68 |
| B | 0.21 | 0.92 | 77 | |
| “FAS”-02 | A | 0.08 | 0.56 | 86 |
| B | 0.12 | 0.78 | 85 | |
| “FAS”-03 | A | 0.47 | 0.96 | 51 |
| B | 0.24 | 0.98 | 76 | |
| Sor: Residual oil saturation | ||||
For Reservoir B, the gross thickness varied from 9.91 m (32.5 ft) in FAS-01 to 36.27 m (119 ft) in FAS-06. The Vsh ranged from 0.03 (3%) in FAS-3 to 0.11 (11%) in FAS-08. The total porosity is between 0.22 (22%) in FAS-05 and 0.27 (27%) in wells (FAS-01 and FAS-08). Effective porosity varied from 0.17 (17%) in FAS-05 to 0.23 (23%) in FAS-08. Residual water saturation ranged from 0.77 (77%) in FAS-03 to 0.98 (98%) in FAS-05. Residual oil saturation varied from 0.02 (2%) in FAS-05 to 0.24 (24%) in FAS-03.
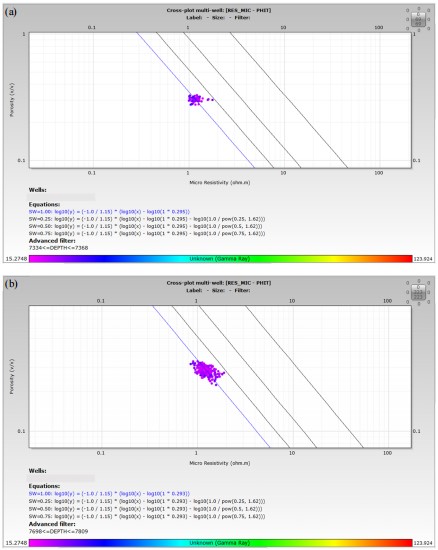
Figure 6a-b represent a typical Pickett plot of porosity against the resistivity log plotted on a log-log graph. The scatter plot was used to estimate the mud filtrate resistivities in reservoirs (A and B), which indicate the rate of displacement of the formation water by the mud filtrate. The trend lines at Sw equal 25.0, 50.0, 75.0, and 100% were established on the graph. The point where the water-bearing trend line (blue) intersects the resistivity axis (at 100% water saturation) represents the zone where the mud filtrate completely displaced the formation water. The corresponding resistivity value at the intersection point is taken as the mud filtrate resistivity (Rmf). This value serves as one of the inputs in the Archie equation for estimating residual water saturation (Eq. 5).
Table 3 presents the percentage mean deviation of the computed Sor from the Archie equation concerning the core Sor for the reservoirs (A and B) in wells (FAS-01, FAS-02, and FAS-03). This offers a quantitative assessment of the Archie model’s reliability. The computed Sor (Archie) values are significantly lower than the core Sor values across all wells and reservoirs, with mean deviations ranging from 51 to 86%. The highest deviation (86%) is observed in Well “FAS”-02A, while the lowest (51%) occurs in Well “FAS”-03A.
|
DISCUSSION
A typical histogram plot of the gamma-ray log in FAS-01, provides the minimum and maximum gamma-ray values, 15.08 API and 95.31 API, respectively. The distribution of the gamma-ray plot is described as bimodal, which clearly shows the two lithologies (sand and shale). It also provides the cut-off for the lithologies at 70 API. Other wells (FAS-02 to FAS-08) have their minimum gamma ray values (sand line) ranging from 9.00 API (FAS-03) to 15.30 API (FAS-04), while the maximum gamma ray values (shale line) range from 92.27 API (FAS-06) to 106.34 API (FAS-04). These values were used to estimate the gamma-ray indexes, which were further used for the volume of shale computation. The gamma-ray log distribution in all the wells follows a similar pattern (Table 1). The identified sand and shale lines (Table 1) extensively contribute to understanding the lateral variation of lithologies across the study area. The relatively thicker reservoir in FAS-05 suggests a more favorable area for sediment deposition, potentially closer to the depositional center, while the thinner reservoir in FAS-08 may indicate a marginal or distal setting. Thicker reservoir intervals generally provide greater hydrocarbon storage capacity, enhancing production potential. By comparing the gamma-ray log responses in the wells (Fig. 5), a more comprehensive picture of the overall reservoir architecture was constructed. The mapped reservoirs (A and B) appear to be laterally continuous across the wells. These reservoirs generally have appreciable thickness in the Southwestern part of the field and thin out towards the Northeastern part. This analysis is essential for reservoir characterization, as it informs decisions regarding potential hydrocarbon zones, as well as further exploration and development strategies in the field18.
The petrophysical properties presented (Table 2) offer valuable insights into the characteristics and potential productivity of reservoirs A and B across the eight wells (FAS-01 to FAS-08). A comparative analysis of these properties highlights the variability in reservoir quality and hydrocarbon potential in the study area. The differences in petrophysical properties between and within reservoirs A and B highlight the heterogeneity of the field, which was presented by estimating reservoir thickness, shale content, porosity, and saturation values.
The mapped reservoir A has varying thickness values, ranging from 10.36 m (34 ft) in FAS-08 to 14.94 m (49 ft) in FAS-05, indicating relatively moderate continuity across the wells. This suggests potential localized variations in the lithologies, which might influence hydrocarbon storage capacity. The quality of the reservoir was determined by estimating the volume of shale and other petrophysical properties (porosity, residual water saturation, and residual oil saturation). The shale volumes (Vsh) varied from 0.08 (8%) in FAS-01 to 0.18 (18%) in FAS-06, indicating that the shale content is generally low to moderate. Wells with lower Vsh values (e.g., FAS-01) are likely to have better reservoir quality, as less shale content implies improved porosity and permeability. Shale-rich intervals often have reduced connectivity between pore spaces, which can hinder fluid flow, whereas sand-rich intervals typically exhibit better permeability and can serve as potential hydrocarbon reservoirs. The low shale volume (8% in FAS-01) suggests excellent reservoir quality with minimal impact on permeability and fluid flow. The higher shale volume (18% in FAS-06) could reduce reservoir permeability and introduce barriers to fluid flow, possibly requiring enhanced recovery techniques. Another reservoir property that was estimated is the total porosity (Table 2), which ranged from 0.25 (25%) in FAS-05 to 0.30 (30%) in FAS-02, while the effective porosity ranged from 0.21 (21%) in FAS-05 to 0.26 (26%) in FAS-01 and FAS-02. These high porosity values indicate good pore space availability, which is favorable for hydrocarbon storage and flow. Wells like FAS-01 and FAS-02, with higher effective porosity, are expected to have better reservoir connectivity. The fluid saturation was also determined across the eight wells. The residual water saturation varied widely, from 0.53 (53%) in FAS-03 to 0.98 (98%) in FAS-06 and FAS-08. Similarly, residual oil saturation (Sor) ranged from 0.02 (2%) in FAS-06 and FAS-08 to 0.47 (47%) in FAS-03. The high Sor in FAS-03 indicates significant remaining oil potential, making it a candidate for enhanced oil recovery (EOR) efforts.
Reservoir B has greater variability in thickness, ranging from 9.91 m (32.5 ft) in FAS-01 to 36.27 m (119 ft) in FAS-06. The significant thickness in FAS-06 indicates higher storage capacity and potentially better hydrocarbon accumulation. It has Vsh values ranging from 0.03 (3%) in FAS-03 to 0.11 (11%) in FAS-08. The lower Vsh in FAS-03 suggests that this well is likely to have cleaner sands, contributing to better reservoir quality compared to wells with higher shale content. The low shale content (3% in FAS-03 to 11% in FAS-08) indicates that Reservoir B is predominantly composed of clean sands, which is favorable for hydrocarbon storage and flow. The slightly higher Vsh in FAS-08 indicates the presence of more shaly intervals, which may locally reduce permeability. Its total porosity varied from 0.22 (22%) in FAS-05 to 0.27 (27%) in FAS-01 and FAS-08, while effective porosity ranged from 0.17 (17%) in FAS-05 to 0.23 (23%) in FAS-08. Well FAS-08, with both high total and effective porosity, is likely to exhibit good reservoir connectivity and flow properties. The reservoir fluid saturation was also estimated. Residual water saturation ranged from 0.77 (77%) in FAS-03 to 0.98 (98%) in FAS-05, while residual oil saturation ranged from 0.02 (2%) in FAS-05 to 0.24 (24%) in FAS-03. Similar to Reservoir A, FAS-03 in Reservoir B has the highest Sor, suggesting significant hydrocarbon potential for additional recovery efforts. Based on reservoir quality classification19, the two reservoirs (A and B) fall in the category of a very good reservoir.
The performance of the Archie equation using the generalized petrophysical exponents was evaluated with the percentage mean deviation between the estimated Sor and the core Sor. Table 3 shows that Sor ranged from 51 to 86%. This indicates a significant difference between the two results (the estimated Sor and the core Sor data). Consequently, it can be inferred that the Archie method using the generalized petrophysical exponents may not be suitable for accurately estimating residual oil saturation in the study area, highlighting the need for alternative approaches or more nuanced petrophysical models. This inference is in agreement with the submissions made1 on the weakness of Archie’s method in shaley sand reservoirs. It was noted that Archie’s assumptions of saturation exponents equal to 2 can only be valid for strongly water-wet rock20. It is advised that Archie parameters must be determined for each reservoir as they strongly depend on rock heterogeneity and wettability conditions.
However, the study is constrained by the limitations of using generalized petrophysical parameters (a = 1, m = 2, and n = 2) for residual oil saturation (Sor) estimation. These generalized values may not accurately reflect the unique characteristics of the reservoirs in the study area, potentially leading to less reliable Sor estimates. To improve the accuracy and reliability of residual oil saturation values, it is recommended that field-specific Archie parameters be computed. This can be achieved by calibrating the Archie equation using core data and site-specific conditions or deriving the petrophysical exponents through advanced techniques. Such methods would provide a more accurate representation of variations in lithology, pore structure, and fluid distribution. By adopting field-specific parameters, future studies can achieve more precise residual oil saturation estimates, ultimately improving the quality of reservoir characterization and supporting more informed decision-making in reservoir management.
CONCLUSION
The study revealed that the petrophysical properties of FAS-03 indicate exceptional reservoir quality and significant potential for hydrocarbon production. In contrast, the other wells exhibit less favorable properties, suggesting that enhanced oil recovery techniques may be necessary to optimize hydrocarbon production from these reservoirs. Considering the percentage mean deviation between the computed Sor and the core Sor, the estimated Sor is deemed unreliable for the study area. This unreliability is attributed to the use of generalized petrophysical exponents in calculating residual water saturation, which may not accurately capture the unique characteristics of the reservoir rocks in the study area. Thus, it is recommended that other methods should be deployed in the study area to complement the conventional method.
SIGNIFICANCE STATEMENT
The study significantly removes the uncertainties in estimating residual oil saturation from the conventional (Archie) method. It primarily provides the guiding principles involved in utilizing well-log data with the generalized Archie parameters (a, m, and n) for residual oil saturation estimation. The study also highlights the limitations of the generalized Archie parameters in shaley sand reservoirs.
REFERENCES
- Ogbeiwi, P., Y. Aladeitan and D. Udebhulu, 2018. An approach to waterflood optimization: Case study of the reservoir X. J. Pet. Explor. Prod. Technol., 8: 271-289.
- Mohamad, A.M. and G.M. Hamada, 2017. Determination techniques of Archie’s parameters: a, m and n in heterogeneous reservoirs. J. Geophys. Eng., 14: 1358-1367.
- Haley, R.A., 1995. Pulsed neutron capture log interpretation in laminated formations: A dual-exponential-decay model. SPE Form. Eval., 10: 20-25.
- Jamaloei, B.Y. and R. Kharrat, 2010. Analysis of microscopic displacement mechanisms of dilute surfactant flooding in oil-wet and water-wet porous media. Transport Porous Media, 81: 1-19.
- Alharbi, R., N. Alageel, M. Alsayil, R. Alharbi and A. Alhakamy, 2022. Prediction of oil production through linear regression model and big data tools. Int. J. Adv. Comput. Sci. Appl., 13: 380-387.
- Archie, G.E., 1942. The electrical resistivity log as an aid in determining some reservoir characteristics. Trans. AIME, 146: 54-62.
- Short, K.C. and A.J. Stäuble, 1967. Outline of geology of Niger Delta. AAPG Bull., 51: 761-779.
- Burke, K., 1972. Longshore drift, submarine canyons, and submarine fans in development of Niger Delta. AAPG Bull., 56: 1975-1983.
- Epuh, E.E., A.I. Moshood, C.J. Okolie, O.E. Daramola and S.A. Akinnusi et al., 2022. Integration of satellite gravimetry, multispectral imagery and digital elevation model for investigating crustal deformation in the Niger Delta Basin. Geosyst. Geoenviron., 1.
- Ogunsanya, O.G., J.B. Asere, O.A. Boboye, K.S. Bosikun and G.A. Adegboye, 2023. Biostratigraphy, palynofacies and organic geochemical characterization of three wells, Western Offshore Niger Delta Nigeria. Open J. Geol., 13: 504-535.
- Avbovbo, A.A., 1978. Tertiary lithostratigraphy of Niger Delta. AAPG Bull., 62: 295-300.
- Reijers, T.J.A., 2011. Stratigraphy and sedimentology of the Niger Delta. Geologos, 17: 133-162.
- Obasuyi, F.O., O. Abiola, O.J. Egbokhare, A.S. Ifanegan and J.I. Ekere, 2019. 3D seismic and structural analysis of middle Agbada reservoir sand, Offshore Niger Delta, Nigeria. J. Geogr. Environ. Earth Sci. Int., 20.
- Olisa, B.A. and A.S. Ifanegan, 2021. Stratigraphic subdivision of tertiary sediments Of Well 1 using total organic carbon (TOC) and gamma ray (GR) log: Case study, the Niger Delta. Sci. Res. J., 9: 46-50.
- Adepehin, D.S., F.F. Magi, A.I. Odudu, M.O. Adelayi and K. Suleiman, 2022. Shale volume effect on hydrocarbon prospectivity of green field, Niger Delta, Nigeria. Phys. Access, 2: 37-53.
- Asquith, G., D. Krygowski, S. Henderson and N. Hurley, 2004. Basic Well Log Analysis. 16th Edn., American Association of Petroleum Geologists, Tulsa, Oklahoma, ISBN: 9781629810492.
- Shehadeh, M., Y. Shennawy and H. El-Gamal, 2015. Similitude and scaling of large structural elements: Case study. Alexandria Eng. J., 54: 147-154.
- Abe, S.J., M.T. Olowokere and P.A. Enikanselu, 2021. Geostatistical modelling of reservoir quality over “Bright” field, Niger Delta. J. Geol. Res., 3: 22-29.
- Harry, T.A., N.J. Etukudo and T.A. Owoeye, 2022. Petrophysical analysis of XYZ field, South-East, Niger Delta using well logs. Int. J. Earth Sci. Knowl. Appl., 4: 259-270.
- Saadat, K., H. Rahimpour-Bonab, V. Tavakoli and J. Gholinezhad, 2024. Experimental investigation and prediction of saturation exponent in carbonate rocks: The significance of rock-fluid properties. J. Pet. Explor. Prod. Technol., 14: 149-163.
How to Cite this paper?
APA-7 Style
Ifanegan,
A.S., Enikanselu,
P.A., Olisa,
B.A., Abiola,
O. (2025). Residual Oil Saturation Estimation Using the Generalized-Archie Parameters, “FAS”-Field, Niger Delta. Asian Journal of Emerging Research, 7(1), 1-13. https://doi.org/10.3923/ajer.2025.01.13
ACS Style
Ifanegan,
A.S.; Enikanselu,
P.A.; Olisa,
B.A.; Abiola,
O. Residual Oil Saturation Estimation Using the Generalized-Archie Parameters, “FAS”-Field, Niger Delta. Asian J. Emerg. Res 2025, 7, 1-13. https://doi.org/10.3923/ajer.2025.01.13
AMA Style
Ifanegan
AS, Enikanselu
PA, Olisa
BA, Abiola
O. Residual Oil Saturation Estimation Using the Generalized-Archie Parameters, “FAS”-Field, Niger Delta. Asian Journal of Emerging Research. 2025; 7(1): 1-13. https://doi.org/10.3923/ajer.2025.01.13
Chicago/Turabian Style
Ifanegan, Ayomide, Samson, Pius Adekunle Enikanselu, Benson Akinbode Olisa, and Olubola Abiola.
2025. "Residual Oil Saturation Estimation Using the Generalized-Archie Parameters, “FAS”-Field, Niger Delta" Asian Journal of Emerging Research 7, no. 1: 1-13. https://doi.org/10.3923/ajer.2025.01.13

This work is licensed under a Creative Commons Attribution 4.0 International License.