
Microbial Profile of Some Wastewater Irrigated Vegetable Types on Akaki River in Galan District of Shaggar City, Oromia, Ethiopia
-
Addisu Tegegn

Oromia Agricultural Research Institute, Food Science Research Directorate, Food Microbiology Research Team, Ethiopia
Zeneba Negesso ArarsoOromia Agricultural Research Institute, Food Science Research Directorate, Food Microbiology Research Team, Ethiopia
| Received 17 May, 2024 |
Accepted 27 Jun, 2024 |
Published 28 Jun, 2024 |
Background and objective: Vegetables of different types are being produced following the river bank of Akaki River which is the most polluted river in Ethiopia. This study was designed to investigate the microbial contamination level of different waste water irrigated vegetable types. Thus the microbial contamination level of those vegetables need to be quantified. Materials and Methods: Samples of different vegetable types were collected using random sampling technique following Akaki River bank from three CFUs, namely Hechu, Gemeda and Dawara Tino. Microbiological profile of each sample was determined by following standard procedures. Results: Samples from Gammada and Dawara Tono kebeles had shown a maximum level of total coliform contamination with log10 CFU/g of 5.042. A relatively higher faecal coliform contamination was still recorded in Dawara Tino kebele. A maximum level of Staphylococcus aureus was obtained from cabbage samples in Hechu kebele. Samples from Hechu kebele exhibited a comparatively higher mold and yeast contamination level with 4.797 log10 CFU/g on onion. Conclusion: The use of Akaki River water for irrigation greatly contributed to the microbial contamination of the samples. Exposure of all vegetable types to microbial contamination has a serious health hazard implication for consumers and requires effective sanitary actions to be taken before preparation for consumption.
INTRODUCTION
Vegetables take a considerable share in the daily diet of Ethiopians. They are utilized by all classes of society alike. The World Health Organization recommends that one has to get 5-9 servings of fruits and vegetables daily1. Their significance as an important dietary component is related to their high composition of carbohydrates, proteins, vitamins, minerals and fiber which are crucial from health point of view. According to Aschale et al.2, farmers with holdings in the vicinity of big cities mostly practice vegetable production. In Akaki District, during the dry seasons, vegetable production is facilitated by irrigation water from Akaki River. The Akaki River, which flows through Finfinne City is the most polluted river in the country3. Reports show that industrial4, municipal (latrine and home wastes) and medical wastes like laboratory cultures, wound dressings, blood and other body fluids and needles5,6 are readily disposed off and discharged into the river and its tributaries without proper treatment. As a result, the river’s water has become extremely polluted by heavy metals, different ions and faecal coliforms rendering it a very bad status showing that it doesn’t meet the quality river water standard and hence unsuitable for different purposes such as drinking, swimming, irrigation, aquatic ecosystem preservation, etc.,5. Even though farmers living in the district close to the river are seriously complaining of the deterioration of the quality of the water (personal observation), due to absence of other alternatives, they are using the river for preparation of food, homemade beverages, irrigation and even drinking3.
Little Akaki River has been studied and some important biological and physicochemical parameters have been reported. The magnitude of all the physical and chemical parameters analyzed have extremely exceeded the standard limits set by World Health Organization (WHO), European Union (EU), Ministry of Water Resources (MoWR) and Addis Ababa Water and Sewage Authority (AAWSA). Likewise, the fecal coliforms and the total coliform count were much higher than the critical level of the microorganisms established by the above-mentioned organizations7-10. Among the major sources of contamination of vegetables by fungal, bacterial and parasitic entities is the irrigation water used. There is scarce documentation of the level of microbiological contamination of the vegetables produced by Akaki District farmers from Akaki River water irrigation. Therefore, the current investigation is initiated to study the degree of microbial contamination of some vegetables produced by Akaki farmers.
MATERIALS AND METHODS
Study area: The study was conducted in Galan District of Shaggar City, the then Oromia Special Zone Surrounding Finfinne starting from October to December, 2022. The city administration contains 12 sub-cities, 36 districts and 40 rural kebeles (the smallest administrative unit).
Sample collection and preparation: Samples of vegetables were collected by employing a random sampling technique from the river bank irrigated vegetables, viz, lettuce, Ethiopian kale, collard greens, cabbage, beetroot and onion at the time of harvesting. Samples were collected from each type of vegetable at the representative sites and aseptically put into sterile polyethylene zip bags and transported to Oromia Agricultural Research Institute Food Science Lab for analysis and stored at 4°C for later analysis11. About 25 g of each vegetable type sample was soaked for 15 min and washed by shaking thoroughly with 225 mL of physiological saline water (PSW). Serial dilutions of each vegetable washing were made in sterile physiological saline water at dilutions 10–1 to 10–8.
Microbial analysis
Standard plate count (SPC): Laboratory analysis was performed to investigate standard plate count in accordance with the method used by Zerihun et al.12.
Enumeration of total and faecal coliforms: Samples were prepared as described above. Homogenate or the rinse fluid was prepared using physiological saline water (PSW). For each selected dilution, 0.1 mL of sample was spread-plated onto violet red bile agar (HiMedia, India). The plates were incubated at 37°C for 24 hrs and the number of pink (coliform) and purple colonies was counted11. Identification of coliforms was carried out with IMVIC tests and enumeration of faecal coliform was conducted by following MPN technique13.
Detection and enumeration of Staphylococcus aureus: A volume of 0.1 mL aliquot of appropriate dilution was spread-plated in duplicate on presolidified plates of Mannitol Salt Agar. Inoculated plates were incubated at 35°C for 24 hrs. Yellow colonies on Mannitol Salt Agar plates were picked aseptically for further identification procedures and confirmed employing cell morphology, gram staining, motility and catalase tests.
Enumeration of mold and yeast: Laboratory analyses to enumerate yeasts and molds were performed in accordance with the method employed by Toumas14 with slight modifications.
RESULTS AND DISCUSSION
The 16 samples of different vegetable types, namely, cabbage, collard greens, Ethiopian cabbage, lettuce, beet root and onion were collected at harvesting time from three kebeles (Hechu, Gammada and Dawara Tinno) of Akaki District following Akaki River bank. Each of the samples was tested for microbial quality. Total bacteria, total coliform, faecal coliform, Staphylococcus aureus and yeast and mold were counted for each of the samples.
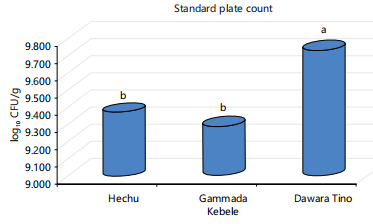
Standard plate count (SPC): At Hechu kebele, among the vegetable types collected, the maximum mean log10 CFU/g of 9.643 (range: 9.347 to 9.913) of standard plate count was recorded from cabbage samples. Whereas the minimum mean value was obtained from onion samples (9.161 log10 CFU/g). The rest of the samples of the vegetable types tested, viz. collard greens, cabbage, beetroot and lettuce had a standard plate count level of 9.527, 9.643, 9.230 and 9.208 log10 CFU/g, respectively (Table 1).
At Gammada kebele, the maximum mean SPC of 9.737 log10 CFU/g was read from cabbage samples. The least value was from lettuce samples with 8.782 log10 CFR/g (range: 8.737 to 8.828 log10 CFU/g). Samples of beetroot and collard greens took the second and third places in terms of SPC with 9.470 and 9.334 log10 CFU/g values, respectively (Table 1).
In Dawara Tino kebele elevated magnitude of SPC was recorded with log10 CFU/g of 9.737. In general, Hechu and Gammada were statistically similar in SPC magnitude, whereas Dawara Tino was significantly higher than the two kebeles (Fig. 1).
A study conducted at the upstream part of the river in Finfinne municipality by Mengesha et al.13 Ethiopian kale and celery reported a far lower level of SPC with a range of 3.3 to 8.0 log10 CFU/g. However, a comparable level of SPC range of 6.8 to 8.5 log10 CFU/g was reported from wastewater irrigated vegetable types produced in Harar Town15. The mean SPC of wastewater-irrigated vegetables produced around Kombolcha town, Northeastern Ethiopia showed a maximum of 4.6 log10 CFU/g which a considerably lower as compared to the current finding16. Similarly, Delesa17 reported a relatively lower mean total bacteria count of 4.2 log10 CFU/g in different localities of Nekemte town. The finding of the current study clearly showed that the microbial quality of the samples couldn’t comply with the WHO standards. Even though SPC doesn’t relate to food poisoning and infection, it is an implication low quality hence probably affecting the shelf life of the products. Thus, consumers need to pay attention to food preparation procedures that make the products adequately free from those contaminants. The study is limited to districts of Shaggar City which was recently established by the regional government.
| Table 1: | Standard plate count (SPC) (log10 CFU/g) values of vegetable samples (Mean±SE) | |||
| Kebele | Vegetable type | Mean | Minimum | Maximum |
| Hechu | Beet root | 9.230±0.233 | 8.98 | 9.441 |
| Onion | 9.161±0.169 | 8.992 | 9.329 | |
| Collard greens | 9.527±0.099 | 9.458 | 9.597 | |
| Ethiopian kale | 9.446±0.471 | 8.903 | 9.737 | |
| Cabbage | 9.643±0.381 | 9.374 | 9.913 | |
| Lettuce | 9.208±0.184 | 9.043 | 9.407 | |
| Gammada | Beet root | 9.470±0.462 | 8.936 | 9.737 |
| Onion | 9.318±0.140 | 9.216 | 9.477 | |
| Collard greens | 9.334±0.326 | 9.008 | 9.659 | |
| Ethiopian kale | 9.136±0.414 | 8.722 | 9.551 | |
| Cabbage | 9.737±0.000 | 9.737 | 9.737 | |
| Lettuce | 8.782±0.046 | 8.737 | 8.828 | |
| Dawara Tino | Beet root | 9.737±0.000 | 9.737 | 9.737 |
| Onion | 9.737±0.000 | 9.737 | 9.737 | |
| Green collards | 9.737±0.000 | 9.737 | 9.737 | |
| Ethiopian kale | 9.737±0.000 | 9.737 | 9.737 | |
| Cabbage | 9.737±0.000 | 9.737 | 9.737 | |
| Lettuce | 9.737±0.000 | 9.737 | 9.737 |
|
| Table 2: | Total coliform count (TCC) (log10 CFU/g) values of vegetable samples (Mean±SE) | |||
| Kebele | Vegetable type | Mean | Minimum | Maximum | Standard category (based on mean) |
| Hechu | Beet root | 4.554±0.844 | 3.58 | 5.042 | Average |
| Onion | 5.042±0.000 | 5.042 | 5.042 | Average | |
| Ethiopian kale | 5.042±0.000 | 5.042 | 5.042 | Average | |
| Collard greens | 5.042±0.000 | 5.041 | 5.042 | Average | |
| Cabbage | 5.042±0.000 | 5.042 | 5.042 | Average | |
| Lettuce | 4.482±0.970 | 3.362 | 5.042 | Average | |
| Gammada | Beet root | 4.849±0.335 | 4.462 | 5.042 | Average |
| Onion | 5.042±0.000 | 5.042 | 5.042 | Average | |
| Ethiopian kale | 5.042±0.000 | 5.042 | 5.042 | Average | |
| Collard greens | 5.042±0.000 | 5.042 | 5.042 | Average | |
| Cabbage | 5.042±0.000 | 5.042 | 5.042 | Average | |
| Lettuce | 5.042±0.000 | 5.042 | 5.042 | Average | |
| Dawara Tino | Beet root | 5.042±0.000 | 5.042 | 5.042 | Average |
| Onion | 5.042±0.000 | 5.042 | 5.042 | Average | |
| Ethiopian kale | 5.042±0.000 | 5.042 | 5.042 | Average | |
| Collard greens | 5.042±0.000 | 5.042 | 5.042 | Average | |
| Cabbage | 5.042±0.000 | 5.042 | 5.042 | Average | |
| Lettuce | 4.849±0.335 | 4.462 | 5.042 | Average |
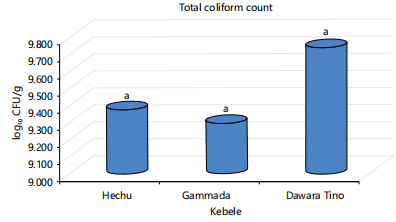
Total coliform count (TCC): All the vegetable samples from each type were analyzed for contamination with coliform bacteria. Total coliform value ranged from 4.482±0.970 to 5.042±0.000 log10 CFU/g at Hechu kebele. Onion, collard greens, Ethiopian kale and cabbage were equally contaminated with total coliforms with the highest value of 5.042±0.000. On the contrary, beet root and lettuce were relatively low in coliform infestation with 4.554±0.844 and 4.482±0.970 log10 CFU/g, respectively (Table 2).
Analysis of samples showed a similar level of coliform contamination was obtained in samples from Gammada kebele. Onion, collard greens, Ethiopian kale, cabbage and lettuce had shown an equivalent value of 5.042±0.000 log10 CFU/g. Beetroot gave a lower value of 4.849±0.335 log10 CFU/g. A comparable magnitude of total coliform was observed in samples from Dawara Tino kebele with the exception that lettuce gave the least value of 4.849±0.335 log10 CFU/g. Overall, there was no significant statistical variability among the kebeles with respect to total coliform count (Fig. 2). On the basis of HACCP-TQM technical guidelines, all the samples have shown an “average” contamination level with respect to TCC (Table 2).
|
Degaga et al.5 reported a relatively lower value of coliform contamination ranging from 3.7 to 3.9 log10 CFU/g in lettuce, cabbage, carrot and tomato in North Western Ethiopia. Similarly, a value range of 3.05 to 4.54 log10 CFU/g was reported in cabbage, lettuce and carrot samples in the different sub-cities of Nekemte town17. On the contrary, Alamnie et al.15 reported a comparatively higher total coliform value ranging from 6.792 to 5.708 log10 CFU/g from wastewater produced lettuce, spinach, kale and cabbage samples in Harar Town. Similarly, Al-Gamal et al.18 reported that a total coliform count value range of 5.0±0.29 to 5.7±0.41 in wastewater irrigated vegetable samples in Egypt. The total coliform content of majority of the samples falls under unsatisfactory standards making it unsafe for consumption without adequate processing treatments like cooking. Total coliforms are among indicator microorganisms whose presence in wastewater-irrigated vegetables and other food and water warn of potential contamination by pathogenic microorganisms which pose a risk of food-borne diseases to consumers.
Faecal coliform count: Analysis of faecal coliform for the vegetable samples showed that the highest contamination level of 5.042±0.000 (minimum: 5.042; maximum: 5.042) was recorded on cabbage and the least value of 3.702±0.333 (minimum: 3.447; maximum: 4.079) was obtained from beetroot samples. A relatively higher degree of fecal coliform contamination was obtained from samples collected from Gammada kebele with a range of 3.759 log10 CFU/g in lettuce to 5.041 log10 CFU/g in beetroot and collard greens (Table 1). Onion, Ethiopian kale and cabbage gave a fecal coliform value range of 4.623 to 4.695 log10 CFU/g. According to HACCP-TQM technical guidelines, most of the samples have attained an “average” contamination status with samples of beetroot, collard greens and lettuce taking a “good” status in FCC population (Table 3).
This finding was in agreement with the report of Woldetsadik et al.6. Lettuce samples collected from different farm sites in Addis Ababa City had shown a mean fecal coliform contamination range of 3.46±0.44 to 5.03±1.38 log10 MPN/g. However, a comparatively lower FCC (3.3 to 3.5 log10 CFU/g) was reported by Berhanu et al.16 from lettuce (3.5±0.4), cabbage (3.3±0.2), carrot (3.5±0.2) and tomato (3.5±0.2) samples in Northeastern Ethiopia. Samples of Ethiopian kale, lettuce and Swiss chard collected from Akaki River exhibited an FC contamination range of 10 to 2800 CFU/g in parts of Addis Ababa City and Oromia Special Zone surrounding Finfinne13. In the current study, each of the samples collected from
|
| Table 3: | Fecal coliform count (FCC) (log10 CFU/g) of vegetable samples in the three kebeles | |||
| Kebele | Vegetable type | Mean | Minimum | Maximum | Standard category (based on mean) |
| Hechu | Beet root | 3.702±0.333 | 3.447 | 4.079 | Good |
| Onion | 4.499±0.177 | 4.322 | 4.676 | Average | |
| Ethiopian kale | 4.071±0.146 | 3.968 | 4.174 | Average | |
| Collard greens | 3.968±0.930 | 3.431 | 5.042 | Good | |
| Cabbage | 5.042±0.000 | 5.042 | 5.042 | Average | |
| Lettuce | 3.769±1.115 | 2.964 | 5.042 | Good | |
| Gammada | Beet root | 5.042±0.000 | 5.041 | 5.042 | Average |
| Onion | 4.695±0.332 | 4.38 | 5.041 | Average | |
| Ethiopian kale | 4.623±0.419 | 4.204 | 5.042 | Average | |
| Collard greens | 5.042±0.000 | 5.042 | 5.042 | Average | |
| Cabbage | 4.852±0.268 | 4.663 | 5.042 | Average | |
| Lettuce | 3.759±1.283 | 2.476 | 5.041 | Good | |
| Dawara Tino | Beet root | 5.042±0.000 | 5.042 | 5.042 | Average |
| Onion | 4.922±0.120 | 4.802 | 5.042 | Average | |
| Ethiopian kale | 5.042±0.000 | 5.042 | 5.042 | Average | |
| Collard greens | 5.042±0.000 | 5.042 | 5.042 | Average | |
| Cabbage | 5.042±0.000 | 5.042 | 5.042 | Average | |
| Lettuce | 4.849±0.335 | 4.462 | 5.042 | Average |
further downstream along the bank of Akaki River, in Dawara Tino kebele, has shown a relative increase in the fecal coliform infestation as compared to the rest of the sampling kebeles (Fig. 3). On average there was an increment of 2.444 log10 CFU/g down along the river. The HACCP-TQM technical guidelines, state that, faecal coliforms/Escherichia coli the estimated illness dose is 6-10 log10 CFU/gm and the suggested level for purchase is 1 log10 CFU/gm. Accordingly, from mean values, it could be observed that almost all the values were below the threshold set implying a lower health effect. However, it was found to be far above the set purchase standard.
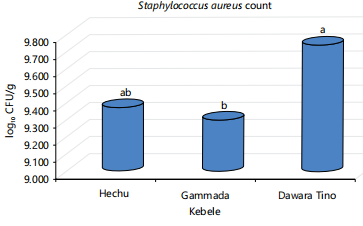
Staphyloccocus aureus count (SC): All the samples were tested for contamination by S. aureus. In Hechu kebele, cabbage (6.135±0.000 log10 CFU/g), collard greens (5.046±3.161 log10 CFU/g) and beetroot (4.922±3.059 log10 CFU/g) took first, second and third places, respectively, in terms of S. aureus. Similarly, 4.644±2.815 log10 CFU/g was obtained in lettuce samples. Ethiopian kale samples have been found least contaminated with a value of 1.396±0.000 log10 CFU/g. Onion and Ethiopian kale attained a “good” status in S. aureus contamination, whereas, the rest of the vegetable types were “average” as described by HACCP-TQM technical guideline (Table 4).
|
| Table 4: | Staphyloccocus aureus (SC) (log10 CFU/g) of vegetable samples in the three kebeles | |||
| Kebele | Vegetable type | Mean | Minimum | Maximum | Standard category (based on mean) |
| Hechu | Beetroot | 4.922±3.059 | 1.396 | 6.867 | Average |
| Onion | 2.269±0.872 | 1.396 | 3.141 | Good | |
| Ethiopian kale | 1.396±0.000 | 1.396 | 1.396 | Good | |
| Collard greens | 5.046±3.161 | 1.396 | 6.913 | Average | |
| Cabbage | 6.135±0.000 | 6.135 | 6.135 | Average | |
| Lettuce | 4.644±2.815 | 1.396 | 6.374 | Average | |
| Gammada | Beet root | 1.396±0.000 | 1.396 | 1.396 | Good |
| Onion | 4.988±3.114 | 1.396 | 6.936 | Average | |
| Ethiopian kale | 1.396±0.000 | 1.396 | 1.396 | Good | |
| Collard greens | 3.765±2.369 | 1.396 | 6.135 | Good | |
| Cabbage | 3.779±3.370 | 1.396 | 6.163 | Good | |
| Lettuce | 1.396±0.000 | 1.396 | 1.396 | Good | |
| Dawara Tino | Beet root | 4.174±3.929 | 1.396 | 6.952 | Average |
| Onion | 5.596±0.715 | 4.881 | 6.311 | Average | |
| Ethiopian kale | 5.309±3.413 | 1.396 | 7.668 | Average | |
| Collard greens | 4.200±2.804 | 1.396 | 7.004 | Average | |
| Cabbage | 1.396±0.000 | 1.396 | 1.396 | Good | |
| Lettuce | 7.093±0.307 | 6.842 | 7.436 | Poor |
In Gammada kebele, most of the vegetable types had been found to show lower SC levels. Onion, cabbage and collard greens showed SC contamination levels taking from 1st to 3rd places with values of 4.988, 3.779 and 3.765 log10 CFU/gm, respectively. Beet root, Ethiopian kale and lettuce became the least contaminated. Most of the vegetable types exhibited a “good” status in SC except onion which showed an “average” level of contamination (Table 4).
In Dawara Tino kebele, however, the level of SC has been shown to be lifted as compared to Gammada with some of the samples still being lowered. The highest and the lowest levels were taken by lettuce (7.093±0.307 log10 CFU/g) and cabbage (1.396±0.000 log10 CFU/g). Ethiopian kale, collard greens and onion, too, had a significant level of contamination ranging from 4.200±2.804 to 5.596±0.715 log10 CFU/g (Table 4). There was a significant statistical difference among the kebeles in SC (Fig. 4). With most of the vegetable types being “average” in SC infestation level, cabbage had shown a “good” status, whereas, lettuce had shown a “poor” level of contamination (Table 4).
Even though most of the works in Ethiopia failed to consider S. aureus count in wastewater-irrigated vegetable samples, Weldezgina and Muleta19 reported it in the vegetables produced by irrigation from Awetu River in Jimma town.

|
A maximum S. aureus contamination of 2.97±0.3 was obtained in lettuce samples which is lower as compared to the finding of the current result. However, it seems to be comparable with the report of Al-Gamal et al.18 in Gana. Staphylococcus aureus ranged from 4.2-5.2 log10 CFU/g in samples of cucumber, lettuce and arugula. A comparison of the three kebeles showed that there is a significant difference among them in terms of S. aureus showing a general increasing trend downstream along the river (Fig. 4). In general, Schelin et al.20 and Gashaye21 reported that production of enterotoxin reaches when S. aureus count rises to 6 log10 CFU/g. Majority of the samples showed average safety standard with some attaining unsatisfactory status for raw consumption. Fortunately, in all the three sampling sites the values of S. aureus were found to be categorized under average and good standard classes. However, isolation of the microbe from the samples shows poor hygienic status and lack of good agricultural practices including the use of polluted water for irrigation, thus giving a warning signal for taking action to safeguard the health of the consumers by thorough washing and decontamination of the produce especially those used without heat treatment.
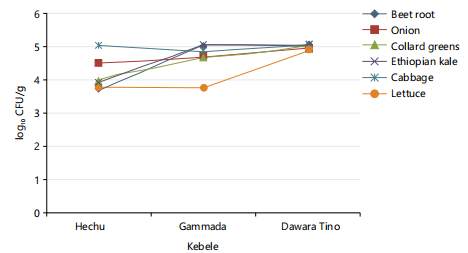
Mold and yeast count: A maximum and minimum mold and yeast count of 4.797±0.394 and 3.931±0.618 log10 CFU/g have been obtained in onion and lettuce samples, respectively from Hechu kebele. An equivalent level of contamination was observed on samples of beet root, collard greens, Ethiopian kale and cabbage with the range of 4.064±0.249 to 4.321±0.086 log10 CFU/g.
Mold and yeast contamination has become relatively lower at Gammada kebele. The maximum level was observed on collard greens with 4.755 log10 CFU/g. A minimum of 2.135±1.279 log10 CFU/g was recorded on beetroot samples. Whereas, the result from Dawara Tino samples has become comparable to that of Hechu kebele with the maximum and minimum range value of 4.525±0.363 to 2.976±0.501 log10 CFU/g on Ethiopian kale and cabbage samples, respectively (Table 5). The three kebeles varied significantly in terms of MYC with relatively lower values observed in Gammada (Fig. 5).
The current result was in line with report of Delesa17. A maximum and minimum mold and yeast contamination values of 4.35 and 3.33 log10 CFU/g were obtained in wastewater-irrigated vegetable samples in Nekemte town. The presence of yeast and mold in vegetables may be associated with some health problems due to the likely production of mycotoxins, with others being able to incite allergies22. Therefore, it is critically important to take serious sanitary measures before going for preparation or consumption.
| Table 5: | Mold and yeast count (log10 CFU/g) in vegetable samples in the three kebeles | |||
| Kebele | Vegetable type | Mean | Minimum | Maximum |
| Hechu | Beet root | 4.164±0.230 | 3.913 | 4.365 |
| Onion | 4.797±0.394 | 4.403 | 5.192 | |
| Ethiopian kale | 4.064±0.249 | 3.888 | 4.24 | |
| Collard greens | 4.194±0.169 | 4 | 4.311 | |
| Cabbage | 4.321±0.086 | 4.26 | 4.382 | |
| Lettuce | 3.931±0.618 | 3.26 | 4.477 | |
| Gammada | Beet root | 2.135±1.279 | 1.396 | 3.612 |
| Onion | 2.611±2.105 | 1.396 | 5.041 | |
| Ethiopian kale | 3.112±1.716 | 1.396 | 4.828 | |
| Collard greens | 4.755±0.125 | 4.631 | 4.88 | |
| Cabbage | 2.962±2.214 | 1.396 | 4.527 | |
| Lettuce | 2.849±1.452 | 1.396 | 4.301 | |
| Dawara Tino | Beet root | 4.037±0.330 | 3.804 | 4.27 |
| Onion | 3.589±0.148 | 3.442 | 3.737 | |
| Ethiopian kale | 4.358±0.172 | 4.237 | 4.555 | |
| Collard greens | 4.525±0.363 | 4.163 | 4.888 | |
| Cabbage | 2.976±1.501 | 1.476 | 4.477 | |
| Lettuce | 3.677±0.487 | 3.357 | 4.237 |
CONCLUSION AND RECOMMENDATION
From the study, it could be understood that the microbial contamination of almost all the samples of the different types of vegetables has exceeded the standard limit set by WHO indicating the potential health hazard associated with the consumption of the inadequately treated vegetables. Analysis of SPC showed that all the samples had a substandard level of hygienic quality for which the consumers should be well aware. Most of the samples from the different types of vegetables were also not entirely free of indicator, pathogenic and spoilage microorganisms to the level safe for human consumption. It is also critical that further research efforts be made that provide safe and effective technologies for the disinfection of the produce for a healthy diet. This requires that effective sanitary and disinfection actions should be taken before preparation for consumption. Moreover, since the major source of microbial contamination of the vegetables being produced along the Akaki River bank is the highly polluted irrigation water, the government should formulate and indicate a corrective policy direction that helps cease the pollution of Akaki River.
SIGNIFICANCE STATEMENT
The study was designed to assess the quality of some irrigated vegetable types produced by irrigation from Akaki River which is the most polluted one in the country. According to the investigation, the majority of the samples exhibited microbial contamination beyond the acceptable limit showing the severity of contamination of the products. All the parameters analyzed, viz., indicator, pathogenic as well as spoilage microorganisms showed a significantly higher count. The finding could provide important information for decision-makers with regard to the health hazards society can face from consumption of the unsafe vegetables, implying the need for taking corrective measures.
ACKNOWLEDGEMENT
We are sincerely grateful to Oromia Agricultural Research Institute for supporting the research project in financial and technical terms.
REFERENCES
- Johnston, L.M., C.L. Moe, D. Moll and L.A. Jaykus, 2005. The Epidemiology of Produce-Associated Outbreaks of Foodborne Disease. In: Microbial Hazard Identification in Fresh Fruit and Vegetables, James, J. (Ed.), John Wiley & Sons, Inc., Hoboken, New Jersey, ISBN: 9780470007761, pp: 37-72.
- Aschale, M., Y. Sileshi and M. Kelly-Quinn, 2019. Health risk assessment of potentially toxic elements via consumption of vegetables irrigated with polluted river water in Addis Ababa, Ethiopia. Environ. Syst. Res., 8.
- Yohannes, H. and E. Elias, 2017. Contamination of rivers and water reservoirs in and around Addis Ababa City and actions to combat it. Environ. Pollut. Clim. Change, 1.
- Leta, S., F. Assefa, L. Gumaelius and G. Dalhammar, 2004. Biological nitrogen and organic matter removal from tannery wastewater in pilot plant operations in Ethiopia. Appl. Microbiol. Biotechnol., 66: 333-339.
- Degaga, B., I. Sebsibe, T. Belete and A. Asmamaw, 2022. Microbial quality and safety of raw vegetables of Fiche town, Oromia, Ethiopia. J. Environ. Public Health, 2022.
- Woldetsadik, D., P. Drechsel, B. Keraita, F. Itanna, B. Erko and H. Gebrekidan, 2017. Microbiological quality of lettuce (Lactuca sativa) irrigated with wastewater in Addis Ababa, Ethiopia and effect of green salads washing methods. Int. J. Food Contamination, 4.
- Mekuria, D.M., A.B. Kassegne and S.L. Asfaw, 2021. Assessing pollution profiles along Little Akaki River receiving municipal and industrial wastewaters, Central Ethiopia: Implications for environmental and public health safety. Heliyon, 7.
- Mulu, A., T. Ayenew and S. Berhe, 2015. Impact of slaughterhouses effluent on water quality of Modjo and Akaki River in Central Ethiopia. Int. J. Sci. Res., 4: 899-907.
- Chaturvedi, M., V. Kumar, D.Singh and S. Kumar, 2013. Assessment of microbial load of some common vegetables among two different socioeconomic groups. Int. Food Res. J., 20: 2927-2931.
- Kaur, P. and N. Rai, 2015. Bacteriological analysis of fresh vegetables from main market of Dehradun. Int. J. PharmTech Res., 8: 415-425.
- Frampton, E.W., L. Restaino and N. Blaszko, 1988. Evaluation of the β-glucuronidase substrate 5-bromo-4-chloro-3-indolyl-β-D-glucuronide (x-GLUC) in a 24-hour direct plating method for Escherichia coli. J. Food Prot., 51: 402-404.
- Zerihun, B., G. Edao and C. Bayissa, 2020. Assessment of microbiological quality and drug resistance patterns of raw vegetables irrigated with Hasassa River, West Arsi Zone, Oromia Region, Ethiopia. Afr. J. Microbiol. Res., 14: 507-515.
- Mengesha, S.D., Y.B. Asfaw, A.W. Kidane, K.T. Teklu and M.G. Serte et al., 2023. Microbial risk assessment and health concern of vegetables irrigated with Akaki River in Addis Ababa, Ethiopia. Sci. Afr., 19.
- Tournas, V.H., 2005. Moulds and yeasts in fresh and minimally processed vegetables and sprouts. Int. J. Food Microbiol., 99: 71-77.
- Alamnie, G., A. Kebede and S. Menkir, 2018. Microbiological quality of leafy vegetables irrigated with wastewater in Harar Town vegetable farm, Eastern Ethiopia. Food Sci. Qual. Manage., 79: 1-8.
- Berhanu, L., M. Abebe, A. Gizeyatu, G. Berihun, D. Teshome and Z. Walle, 2022. Evaluation of the effect of wastewater irrigation on the microbiological quality of vegetables in Northeast Ethiopia: Implication for food-borne infection and intoxications. Environ. Health Insights, 16.
- Delesa, D.A., 2017. Intestinal parasitic and bacteriological contamination of raw vegetables from selected farms and markets in Nekemte, Ethiopia. Int. J. Adv. Res. Biol. Sci., 4: 191-200.
- Al-Gamal, M.S., A.A.K. Abou-Arab, M.A. Abou Donia, L. El-Sideek, A.A. Radwan and E.T. Mohamed, 2019. Bacterial contamination of vegetables irrigated with wastewater. Curr. Sci. Int., 8: 776-788.
- Weldezgina, D. and D. Muleta, 2016. Bacteriological contaminants of some fresh vegetables irrigated with Awetu River in Jimma Town, Southwestern Ethiopia. Adv. Biol., 2016.
- Schelin, J., N. Wallin-Carlquist, M.T. Cohn, R. Lindqvist and G.C. Barker, 2011. The formation of Staphylococcus aureus enterotoxin in food environments and advances in risk assessment. Virulence, 2: 580-592.
- Gashaye, D., 2020. Wastewater-irrigated urban vegetable farming in Ethiopia: A review on their potential contamination and health effects. Cogent Food Agric., 6.
- Tournas, V.H. and E. Katsoudas, 2005. Mould and yeast flora in fresh berries, grapes and citrus fruits. Int. J. Food Microbiol., 105: 11-17.
How to Cite this paper?
APA-7 Style
Tegegn,
A., Ararso,
Z.N. (2024). Microbial Profile of Some Wastewater Irrigated Vegetable Types on Akaki River in Galan District of Shaggar City, Oromia, Ethiopia. Asian Journal of Emerging Research, 6(1), 31-40. https://doi.org/10.3923/ajer.2024.31.40
ACS Style
Tegegn,
A.; Ararso,
Z.N. Microbial Profile of Some Wastewater Irrigated Vegetable Types on Akaki River in Galan District of Shaggar City, Oromia, Ethiopia. Asian J. Emerg. Res 2024, 6, 31-40. https://doi.org/10.3923/ajer.2024.31.40
AMA Style
Tegegn
A, Ararso
ZN. Microbial Profile of Some Wastewater Irrigated Vegetable Types on Akaki River in Galan District of Shaggar City, Oromia, Ethiopia. Asian Journal of Emerging Research. 2024; 6(1): 31-40. https://doi.org/10.3923/ajer.2024.31.40
Chicago/Turabian Style
Tegegn, Addisu, and Zeneba Negesso Ararso.
2024. "Microbial Profile of Some Wastewater Irrigated Vegetable Types on Akaki River in Galan District of Shaggar City, Oromia, Ethiopia" Asian Journal of Emerging Research 6, no. 1: 31-40. https://doi.org/10.3923/ajer.2024.31.40

This work is licensed under a Creative Commons Attribution 4.0 International License.