
Response of Maize (Zea maize) to Phosphorus Fertilizer Rates on Nitisols in Assosa Zone of Benishangul Gumuz Region, Western Ethiopia
-
Getahun Dereje

Holetta Agriculture Research Centre P.O. Box 31, Holetta, Ethiopia
Dereje AlemuAssosa Agricultural Research center, EIAR P.O. Box 31, Holetta, Ethiopia
| Received 17 Jun, 2019 |
Accepted 21 Aug, 2019 |
Published 15 Nov, 2019 |
Background and Objectives: Poor nutrient management is one of the key factors contributing to decline in the productivity of maize in Assosa. In order to investigate the effect of different phosphorus levels on the yield and yield components of maize on Nitisols in Assosa Zone during 2012-2014. Materials and Methods: The experiment was arranged in a randomized complete block design with six levels of phosphorous fertilizer (0, 23, 46, 69, 92 and 115 kg of P2O5 ha-1) with three replications. Results: The results revealed substantial responses of maize to phosphorus fertilizer rates on plant height, cob height, cob length and grain yield. Grain yield increased significantly from 4724.8 to 6427.9 kg ha-1. The magnitude of increase in grain yield due to application of P2O5 was 30.6% higher as compared to the control. Extractable soil P concentrations (Bray II, 0-20 cm depth) three weeks after planting significantly responded to P fertilizer rate. Conclusion: Correlations of relative yield with soil test phosphorous values showed that the critical soil P concentration and average phosphorous requirement factor (Pf) calculated from soil test phosphorous values of all treatments for the study area were 6.8 and 7.00 mg kg-1, respectively.
INTRODUCTION
Maize (Zea mays L.) is an important cereal crop growing across all the agro-ecological zones in Ethiopia as well as in the world. Considering its importance in terms of having wider adaptation, higher total production and higher productivity, compared to other crops, maize has been selected as one of the high priority crops to feed the ever-increasing human population of Ethiopia. Maize yields under farmers' conditions in the region average 3.38 t ha-1 or less than 62% of the potential yield of 5.5 t ha-1 under rain fed conditions1. Many authors have identified different limiting factors of maize production in the world; among which are, frequent droughts; the inherently poor soils2 practices (especially planting densities and dates) coupled with low use of improved inputs such as fertilizers and seeds, especially in high rainfall belt3. The low soil fertility is due to increasing pressure on land because of an increase in the human population in Ethiopia. This farming system results in soil nutrient deficiencies, particularly for the essential soil nutrients; nitrogen (N) and phosphorus (P)4.
Phosphorous is the most yield limiting of soil-supplied elements, and soil P tends to decline when soils are used for agriculture5. Studies on Nitisol areas, in the western Ethiopia are marginally to severely deficient in P. The blanket recommendations that are presently in use all over the country were issued several years ago, which may not be suitable for the current production systems6,7. Since the spatial and temporal fertility variations in soils were not considered, farmers have been applying the same P fertilizer rate to their fields regardless of soil fertility differences. Plant growth behavior is influenced by the application of phosphorus8. It is needed for growth, utilization of sugar and starch, photosynthesis, nucleus formation and cell division, fat and albumen formation. Energy from photosynthesis and the metabolism of carbohydrates is stored in phosphate compounds for later use in growth and reproduction9. It is readily translocated within the plants, moving from older to younger tissues as the plant forms cells and develops roots, stems and leaves10. Adequate P results in rapid growth and earlier maturity and improves the quality of vegetative growth11. Masood et al.8 and Ali et al.10 reported significant effect of P application on grain yield; whereas Ayub et al.9 observed significant effect of P application on dry matter yield and individual plant characteristics like height, number of leaves and leaf area.
Phosphorus calibration is a means of establishing a relationship between a given soil test value and the yield response from adding nutrient to the soil as fertilizer. It provides information how much nutrient should be applied at a particular soil test value to optimize crop growth without excessive waste and confirm the validity of current P recommendations12,13. They enable to revise fertilizer recommendations for an area based on soil and crop type, pH and soil moisture content at time of planting. An accurate soil test interpretation requires knowledge of the relationship between the amount of a nutrient extracted by a given soil test and the amount of plant nutrients that should be added to achieve optimum yield for a particular crop14,15. Soil tests are designed to help farmers predict the available nutrient status of their soils. Once the existing nutrient levels are established, producers can use the data to best manage what nutrients are applied, decide the application rate and make decisions concerning the profitability of their operations16. However, local assessments for the soil P critical levels and soil P requirement factors even for the major crops of the country are negligible13. Currently, soil fertility research improvement is agreed with respect to site specific fertilizer recommendation in the country.
Soil test-based and site-specific nutrient management has been a major tool for increasing productivity of agricultural soils. Therefore, the objectives of this study were to correlate the Bray-II soil test P with the relative grain yield response of maize across selected Nitisol areas of Assosa Zone, to established preliminary agronomic interpretations, and to determine the critical P concentration and P requirement factor.
MATERIALS AND METHODS
Description of the Study Area: The experiment was conducted in Assosa Zone at Bambasi districts, western Ethiopia, in the main rainy seasons of 2012, 2013 and 2014. The study sites are located between 1300 and 1470 m.a.s.l. with the minimum and maximum temperatures of 14.5 and 28.8oC, respectively. It is characterized by hot humid agro-ecology having mean annual rainfall of 1358 mm per annum. The predominant soil type is Nitisols17.
Treatments, Experimental Design and Procedures: The treatments comprised six levels of phosphorous fertilizer P (0, 23, 46, 69, 92 and 115 kg of P2O5 ha-1) and laid out in a randomized complete block design with three replications. The gross plot size was 4.5×5.1 m = 22.95 m2. The net plot size was determined with area and plant density leaving the one outermost row and sides of each row. The harvested plot area was 15.3 m2. Urea and triple super phosphate (TSP) were used as the source of N and P, respectively. The recommended rate of N was applied uniformly to all treatments. Application of urea was in two split, while the entire rate of phosphorus was applied at sowing in band. The experimental land was well prepared. Each plot and block was separated by 0.75 m and 1.5 m, respectively. BH-543 maize variety was used for the experiment with row planting method. The usual intra and inter spacing (75×30 cm) of maize was used in this trial. Important agronomic practices were uniformly applied to all experimental plots as often as required. Land preparation was done with local maresha using oxen plough. An improved BH-543 maize variety was planted to the specified treatments. Sowing was made from early of June to the last week of June depending on the onset of rainfall. Weeding and harvesting were done at the appropriate time according to the research recommendations. Harvesting was done at physiological maturity.
Determination of critical P concentration (Pc): to correlate relative yield vs. soil test P values and determine critical P concentration, the available P was extracted from the soil samples taken three weeks after planting from each plot of all experimental fields using Bray-II method. The Cate-Nelson graphical method18 was used to determine the critical P value using relative yields and soil test P values obtained from 20 P fertilizer trials conducted at different sites. To assess the relationship between seed yield response to nutrient rates and soil test P values, relative seed yields in percent were calculated as follows:
| $$ \text { Reactive yield }(\%): \frac{\text { yield }}{\text { maximum yield }} \times 100 $$ | (1) |
The scatter diagram of relative yield (y-axis) versus soil test values (X-axis) was plotted. The range in values on the Y-axis was 0 to 100%. A pair of intersecting perpendicular lines was drawn to divide the data into four quadrants. The vertical line defines the responsive and non-responsive ranges. The observations in the upper left quadrants overestimate the P fertilizer requirement while the observations in the lower right quadrant underestimate the fertilizer requirement. The intersecting lines were moved about horizontally and vertically on the graph, always with the two lines parallel to the two axes on the graph, until the number of points in the two positive quadrants was at a maximum (or conversely, the number of points in the two negative quadrants was at a minimum). The point where the vertical line crosses the X-axis was defined as optimum critical soil test level18.
Determination of P requirement factor (Pf): phosphorus requirement factor (Pf) is the amount of P in kg needed to raise the soil P by 1 mg kg-1. It enables to determine the quantity of P required per hectare to raise the soil test by 1 mg kg-1, and to determine the amount of P fertilizer required per hectare to bring the level of available P above the critical level19. It was calculated using available P values in samples collected from unfertilized and fertilized plots. Phosphorous requirement factor was expressed as:
| $$ P_{\mathrm{f}}=\frac{\operatorname{kg} \mathrm{P} \text { applied }}{\Delta \text { Soil } \mathrm{P}} $$ | (2) |
Therefore, the rate of P fertilizer to be applied (Pa) was expressed in terms of critical P concentration (Pc), initial soil P value (Pi) and P requirement factor (Pf).
Pa = (Pc - Pi) × Pf |
(3) |
Data collection and analysis: Sampling and data collection were done from the center of each plot. Parameters like plant height, ear height, cob length and grain yield was collected. Plant height ( cm) was measured from the base of the plant to the top most leaves of the plant. The average value was computed from five randomly selected plants. The grain yield was sampled and measured from the center of each plot, and converted to kg ha-1 for statistical analysis. Analysis of variance was performed following statistical procedures appropriate for the experimental design using SAS computer software. Whenever treatment effects were significant, the means were separated using the least significant difference (LSD) test at 5% level of significance.
RESULTS
Effects of Phosphorus fertilizer on Plant height, Ear height and Ear length of Maize: Plant height, ear height and ear length of maize significantly influenced by application of phosphorus fertilizer (Table 1).
Plant Height: The analysis of variance for plant height (Table 1) showed significant response to P rates levels. The highest plant height was obtained at all applied P rates whereas the lowest plant height was recorded in the control treatment. But, there is no significant difference between applied P fertilizer rates.
Ear height and Ear length: Ear height and length were measured after harvest and it showed statistically significant (P<0.01) difference due to P fertilizer application (Table 1). Significantly higher ear height and length (117.8 & 23.4 cm) were recorded with P2O5 rates of 46 kg ha-1, respectively over the control treatment. However, there is no significant difference between applied P fertilizer rates. The shortest ear height & length (99.7& 11.9 cm) were recorded at control (no application of P fertilizer).
| Table 1: Effects of P on yield and major yield determinant parameters of soybean at Assosa Zone (2012-2014) | |||
| Treatments (P2O5 kg ha-1) | Plant height (m) | Ear height ( cm) | Ear Length ( cm) |
| 0 | 2.03b | 99.7b | 11.9a |
| 23 | 2.29a | 109.0ab | 16.7bc |
| 46 | 2.38a | 117.8b | 23.4c |
| 69 | 2.30a | 113.3ab | 19.5ab |
| 92 | 2.39a | 117.0b | 17.3abc |
| 115 | 2.36a | 116.2b | 16.3abc |
| LSD(0.05) | 0.20 | 15.18 | 6.57 |
| CV(%) | 9.74 | 15.14 | 20.62 |
| Means followed by different letters are significantly different from one another at 5% level of probability | |||
Grain Yield: Grain yield was significantly affected by different levels of Phosphorous. The maximum (6427.9 kg ha-1) grain yield was recorded at application of 46 kg P2O5 ha-1; whereas the minimum (4724.8 kg ha-1) was recorded on control. But, there was no a significant difference among applied P fertilizer rates (Fig. 1). Grain yield increased significantly from 4724.8 to 6427.9 kg ha-1 with increase in the level of P fertilizer from the control to 46 kg P2O5 ha-1. The magnitude of increase in grain yield due to application of 46 kg P ha-1 was 30.6 % higher as compared to the control.
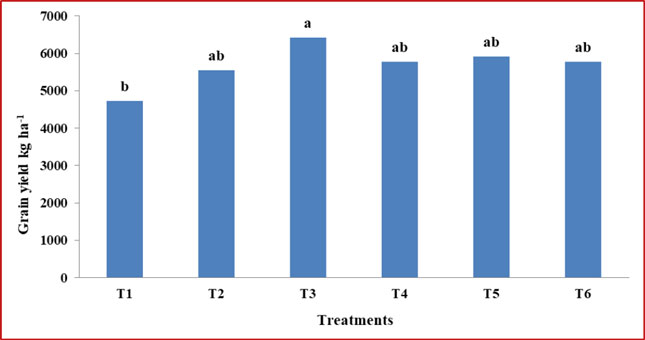 |
Fig 1: Effect of P fertilizer rates on grain yield of maize crop. T1=0, T2=23, T3=46, T4=69 T5=92 and T6=115 kg P2O5 ha-1; CV=24.12 and LSD0.05=1220 and means followed by different letters are significantly different from one another at 5% level of probability |
Critical P concentration (Pc) and P requirement factor (Pf): Soil P values determined three weeks after planting differed significantly (P≤0.05) among P levels. The effect of P fertilizer treatments resulted in mean soil test P values 5 to 92.38 mg kg-1.The increase in soil P content in response to P fertilizer application was linear up to 46 kg P2O5 ha-1. The highest mean soil P concentration (92.38 mg kg-1) was recorded from 69 kg P2O5 ha-1 (Table 2). The relationship between relative grain yield response and soil P measured with the Bray-II method is shown in the Fig. 2.
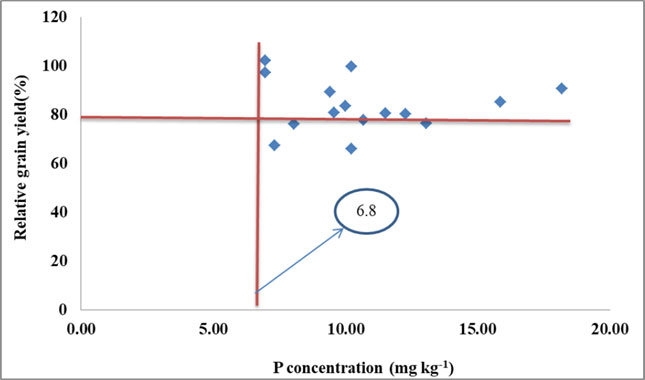 |
Fig 2: Relationships between relative yield response of maize and soil-test P measured using Bray-II method. The arrow indicates the critical P concentration (Pc) for maize on Nitisols. |
When the soil test value is below the critical level, additional information is needed on the quantity of P required to elevate the soil P to the required level. This is the P requirement factor (Pf), the amount of P required to raise the soil test P by 1 mg kg-1, computed from the difference between available soil test P values from plots that received 0-115 kg P2O5 ha-1 using the second formula mentioned above. Accordingly, the calculated Pf were 3.47-11.79 and the overall average Pf of all treatments for the study area was 7.00 (Table 2). Thus, the rate of P fertilizer required per ha can be calculated using the soil critical P concentration, initial soil P determined for each site before planting and the P requirement factor as indicated above in the third formula.
| Table 2: Determination of P requirement factor for maize on Nitisols (2012-2014) | ||||
P2O5 rate (kg ha-1) |
Soil test P (mg kg-1) |
P rise over control |
Phosphorus requirement factor (Pf) |
|
Range |
Average |
|||
0 |
6.96-18.18 |
10.68 |
||
23 |
6.95-20.54 |
13.57 |
2.89 |
3.47 |
46 |
5-36.81 |
15.04 |
4.36 |
4.59 |
69 |
7.57-34.46 |
14.75 |
4.07 |
7.38 |
92 |
7.1- 36.97 |
14.08 |
3.39 |
11.79 |
115 |
7.6-92.38 |
17.13 |
6.45 |
7.76 |
Average |
7.00 |
|||
DISCUSSION
Response of different levels of phosphorus fertilizers on the growth and yield of maize (Zea mays L.) in Assosa Zone of Benishangul Gumuz Region, Western Ethiopia has been revealed by this study. The result obtained from this study showed that different levels of phosphorus fertilizers significantly improved maize growth and yield.
Plant height increased significantly from 2.03 to 2.39 m with increase in the level of P fertilizer from the control to 92 kg P2O5 ha-1. The increment of plant height with increasing P fertilizer application up to optimum level might be the nutrient are involved in vital plant functions and contribute to enhanced growth in the height of the plant. This result also resembles the findings of Jain and Trivedi20 who reported an increase in plant height with phosphorus fertilizer application. Phosphorus improves the root growth which has a great effect on the overall plant growth performance; therefore the regimes of P at the rate of 0 kg ha-1 resulted in the shortest stature plants. Promotion effect of high P level on plant height was probably due to better development of root system and nutrient absorption21. Ali et al.10, Maqsood et al.22, Sharar et al.23 and Yihenew24 reported that plant height of maize increased with increase in P application.
Increasing P2O5 from 0 to 46 kg ha-1 showed a consistent ear length and ear height increment. This might be the liberal availability of plant nutrients which stimulated the plants to increase largest ear height and length as compared to other treatments as phosphorus powerfully encourages flowering and fruiting. The probable reason also could be that at high utilization of nitrophos, favorable environment, optimum utilization of solar light, higher assimilates production and its conversion to starches resulted larger ear height and length25. The increase in P level might have partitioned greater amount of assimilates to ears which resulted in the highest number of rows and grains ear-1 of maize26. Similar results also reported by Bakht et al.27 and Maqsood et al.28 who found the increase of maize yield and its components due to fertilizer applications.
Grain yield was significantly affected by different levels of Phosphorous. Increased in grain yield with the increase in rate of 46 kg P2O5 might be due the importance of phosphorus in a number of metabolic functions and is especially important for grain formation. Similar findings were reported by Masood et al.8, Hussien29, Yosefi et al.30, and Omar31. Phosphorus application at rate of 46 kg P2O5 ha-1 resulted in long stature plants, Cob length and ear height, which resulted in greater grain yield as compared to other P levels. This disclosed that P at the rate of 46 kg ha-1 might be the optimum rate to cause a desirable increase in production per unit area with per unit increase in P content because the grain yield in the control plots was the lowest whereas it was highest in the plots with P applied at 46 kg ha-1. Grain yield showed decline after 46 kg P2O5 ha-1 application which may be due to toxic or antagonistic effect of higher doses of phosphorus application8. The maximum yield attainable at any given location depends not only on the soil available nutrients and the amounts of fertilizer applied, but also on the amount and distribution of rainfall during the crop season. Availability of nutrients to crops is a function of the soil, crop, environment, and management; their interaction affects fertilizer use efficiency and the crop growth condition32. Similar results were also reported by Hussain et al.21 who found that grain yield increased with phosphorus application. A good and optimum supply of P is associated with increased root growth due to which the plants explore more soil nutrients and moisture. That is why the grain yield was the lowest in the control plots because lack of P deteriorated the roots growth of the plants which negatively affected the other physiological functions of the maize plants in the control plots.
The critical P concentration (Pc) was determined from the scatter diagram drawn using relative grain yields of maize and the corresponding soil test P values for all P2O5 levels (0-115 kg ha-1). According to the Cate-Nelson method, the critical levels of Bray-II P in the top 20 cm of soil is about 6.8 mg kg-1; at values of greater than or equal to 6.8 mg kg-1, the crop achieved about 80% of its maximal yield in the absence of P fertilizer application (Fig. 2). This implies that P fertilizer application could be recommended for a build-up of the soil P to this critical value, or maintaining the soil P at this level. Increasing P beyond this level, the cost of additional P fertilizer to produce extra yield would likely be greater than the value of additional yield. Thus, in soils with available P status below 6.8 mg kg-1, yield of maize could show a significant response to applications of P fertilizers. Whereas in areas with available P status greater than 6.8 mg kg-1, the P concentration in the soil exceeds crop needs so that further addition of P fertilizer may not result in a profitable yield increase. A critical concentration of 6.8 mg P kg-1 for corn response within this category (13-20 mg P kg-1) may be considered very small, and maintenance fertilization can be recommended based on expected nutrient removal with harvest33.
Phosphorous fertilizer application at optimum level is necessary to improve grain yield of maize. Soil fertility is sub-optimal for the production of maize in western Ethiopian particularly on Nitisols where soil pH and the associated P availability are low. Following the pre-planting soil analysis results, all of the trial sites had lower soil P values than the critical P concentration. This had a direct relationship with the crop growth and grain yields. In most cases, soil pH less than 5.5 is deficient in available P and exchangeable cations34. In such soils, the proportion of P fertilizer that could be available to a crop becomes inadequate, unless amended through organic matter or liming34. The results seem promising and could be used as a basis for soil-test P fertilizer recommendation for the production of maize on Nitisol areas Benishangul Gumuz Region of Western Ethiopian. Nevertheless, to develop an effective guideline for wider applicability of soil test based fertilizer recommendations, more research assisted by appropriate soil P extraction methods is required to generate sufficient information for the most important crop-soil systems.
CONCLUSIONS
Positive effects of P fertilizer on yield and some yield components of maize on Nitisols of Assosa zone of Benishangul Gumuz Region. The critical soil P concentration and average phosphorous requirement factor (Pf) calculated from soil test phosphorous values of all treatments for the study area were 6.8 and 7.00 mg kg-1, respectively. The results may be used as a basis for P fertilizer recommendations for the production of Maize on Nitisol of the study area.
SIGNIFICANCE STATEMENT
This study discovers the information that can be beneficial for wider applicability of soil test based fertilizer recommendations. This study will help the researcher to uncover the critical areas of soil test based critical P fertilizer recommendation that many researchers were not able to explore on study area. Thus a new theory on these develop an effective guide line and more research assisted by appropriate soil P extraction methods is required to generate sufficient information for the most important crop-soil systems.
REFERENCES
- CSA., 2016. The federal democratic republic of Ethiopia, agricultural sample survey. Report on Area and Production of Major Crop. Statistical Bulletin. Central Statistical Agency, Addis Ababa, Ethiopia.
- Arije, D.N., F.M. Akinseye and B.S. Ewulo, 2018. Response of maize (Zea mays L.) growth and yield to different fertilizer application in Rainforest agroecological zone of Nigeria: Evaluation of CERES-maize crop model. Net J. Agric. Sci., 6: 70-76.
- Badu-Apraku, B., M.A.B. Fakorede, A.F. Lum and R. Akinwale, 2009. Improvement of yield and other traits of extra-early maize under stress and nonstress environments. Agron. J., 101: 381-389.
- Bationo, A., U. Mokwunye, P. Vlek, S. Koala and B.I. Shapiro, 2003. Soil Fertility Management for Sustainable Land use in West Africa. In: Soil Fertility Management in Africa: A Regional Perspective, Gichuru, M.P., A. Bationo, M.A. Bekunda, H.C. Goma and P.L. Mafongonya et al. (Eds.)., Academy of Science Publishers, Kenya, pp: 253-292.
- Edelstein, D.M. and D.J. Tonjes, 2012. Modeling an improvement in phosphorus utilization in tropical agriculture. J. Sustainable Agric., 36: 18-35.
- Bekele, T., D. Gorfu and S. Sertsu, 2002. Results of phosphorous soil tes Proceedings of the Workshop on Phosphorous Soil Test Calibration Study, January 2002, EIAR., Addis Ababa, Ethiopia.
- Zeleke, G., G. Agegnehu, D. Abera and S. Rashid, 2010. Fertilizer and soil fertility potential in Ethiopia: Constraints and opportunities for enhancing the system. International Food Policy Research Institute, Washington, DC.
- Masood, T., R. Gul, F. Munsif, F. Jalal and Z. Hussain et al., 2011. Effect of different phosphorus levels on the yield and yield components of maize. Sarhad J. Agric., 27: 167-170.
- Ayub, M., M.A. Nadeem, M.S. Sharar and N. Mahmood, 2002. Response of maize (Zea mays L.) fodder to different levels of nitrogen and phosphorus. Asian J. Plant Sci., 1: 352-354.
- Ali, J., J. Bakht, M. Shafi, S. Khan and W.A. Shah, 2002. Uptake nitrogen as affected by various combinations of nitrogen and phosphorus. Asian J. Plant Sci., 1: 367-369.
- Rashid, A. and K.S. Memon, 2001. Soil and Fertilizer Phosphorus. In: Soil Science, Bashir, E. and R. Bantel (Eds.)., National Book Foundation, Islamabad, pp: 291-302.
- Agegnehu, G. and B. Lakew, 2013. Soil test phosphorus calibration for malting barley (Hordeum vulgare L.) on Nitisols of central Ethiopian highlands. J. Trop. Agric., 90: 177-187.
- Agegnehu, G., P.N. Nelson, M.I. Bird and C. van Beek, 2015. Phosphorus response and fertilizer recommendations for wheat grown on Nitisols in the central Ethiopian highlands. Commun. Soil Sci. Plant Anal., 46: 2411-2424.
- Muir, J.H. and J.A. Hedge, 2002. Corn Response to Phosphorus and Potassium Fertilization at Different Soil-Test Levels. In: Arkansas Soil Fertility Stugies, Slaton, N.A. (Ed.)., Agricultural Experiment Station Research Series 502, University of Arkansas, Fayetteville, Arkansas, pp: 60-62.
- Watson, M. and R. Mullen, 2007. Understanding soil test for plant-available phosphorous. Ohio State University, USA.
- Chala, G., 2016. Soil test phosphorous calibration for potato production on Nitisols of central highlands Ethiopia. Ethiop. J. Sci., 2016: 120-137.
- AsARC., 2014. Strategy document, 2014. Assosa Agricultural Research Center, Assosa.
- Dahnke, W.C. and R.A. Olson, 1990. Soil Test Correlation, Calibration and Recommendation. In: Soil Testing and Plant Analysis, Westerman, R.L. (Ed.). 3rd Edn., Soil Science Society of America, Madison, Wisconsin, pp: 45-71.
- Nelson, L.A. and R.L. Anderson, 1997. Partitioning Soil Test-Crop Response Probability. In: Soil Testing: Correlating and Interpreting the Analytical Results, Peck, T.R. (Ed.). American Society of Agronomy, Madison, WI., pp: 19-39.
- Jain, P.C. and S.K. Trivedi, 2005. Response of chickpea to phosphorus and bio-fertilizers. Legume Res., 28: 30-33.
- Hussain, N., A.Z. Khan, H. Akbar and S. Akhtar, 2006. Growth factors and yield of maize as influenced by phosphorus and potash fertilization. Sarhard J. Agric., 22: 579-583.
- Maqsood, M., A.M. Abid, A. Iqbal and M.I. Hussain, 2001. Effect of various rates of nitrogen and phosphorus on growth and yield of maize. Pak. J. Biol. Sci., 1: 19-20.
- Sharar, M.S., M. Ayub, M.A. Nadeem and N. Ahmad, 2003. Effect of different rates of nitrogen and phosphorus on growth and grain yield of maize (Zea mays L.). Asian J. Plant Sci., 2: 347-349.
- Selassie, Y.G., 2016. Response and economic feasibility of maize (Zea mays L.) to P fertilization in acidic Alfisols of North-Western Ethiopia. Environ. Syst. Res.
- Azeem, K., A. Khan, F. Naz, M. Ilyas, I. Azeem, F. Anwar and W. Ahmad, 2018. The impact of different p fertilizer sources on growth, yield and yield component of maize varieties. Agric. Res. Technol.: Open Access J.
- Okalebo, J.R. and M.E. Probert, 1992. Effects of phosphorus on the growth and development of maize. A search for strategies for sustainable dryland cropping in semi-arid Eastern Kenya. Nairobi Agric. J., 12: 8-20.
- Bakht, J., M.F. Siddique, M. Shafi, H. Akbar and M. Tariq et al., 2007. Effect of planting methods and nitrogen levels on the yield and yield components of maize. Sarhad J. Agric., 23: 553-559.
- Maqsood, M., R. Ali, N. Nawaz and N. Yousaf, 2000. The effect of NPK application in different proportions on the growth and yield of spring maize. Pak. J. Biol. Sci., 3: 356-357.
- Hussein, A.H.A., 2009. Phosphorus use efficiency by two varieties of corn at different phosphorus fertilizer application rates. Res. J. Applied Sci., 4: 85-93.
- Yosefi, K., M. Galavi, M. Ramrodi and S.R. Mousavi, 2011. Effect of bio-phosphate and chemical phosphorus fertilizer accompanied with micronutrient foliar application on growth, yield and yield components of maize (Single Cross 704). Aust. J. Crop Sci., 5: 175-180.
- Omar, A.E.A., 2014. Effect of FYM and phosphorus fertilization on yield and its components of maize. Asian J. Crop Sci., 6: 15-26.
- Fageria, N.K., 2009. The Use of Nutrients in Crop Plants. CRC Press, Boca Raton, FL., USA.
- Mallarino, A.P., 2003. Field calibration for corn of the Mehlich-3 soil phosphorus test with colorimetric and inductively coupled plasma emission spectroscopy determination methods. Soil Sci. Soc. Am. J., 67: 1928-1934.
- Brady, N.C. and R.R. Weil, 2010. Elements of the Nature and Properties of Soils. 3rd Edn., Pearson Educational International, Upper Saddle River, NJ., USA.
How to Cite this paper?
APA-7 Style
Dereje,
G., Alemu,
D. (2019). Response of Maize (Zea maize) to Phosphorus Fertilizer Rates on Nitisols in Assosa Zone of Benishangul Gumuz Region, Western Ethiopia. Asian Journal of Emerging Research, 1(3), 114-122. https://doi.org/10.3923/AJERPK.2019.114.122
ACS Style
Dereje,
G.; Alemu,
D. Response of Maize (Zea maize) to Phosphorus Fertilizer Rates on Nitisols in Assosa Zone of Benishangul Gumuz Region, Western Ethiopia. Asian J. Emerg. Res 2019, 1, 114-122. https://doi.org/10.3923/AJERPK.2019.114.122
AMA Style
Dereje
G, Alemu
D. Response of Maize (Zea maize) to Phosphorus Fertilizer Rates on Nitisols in Assosa Zone of Benishangul Gumuz Region, Western Ethiopia. Asian Journal of Emerging Research. 2019; 1(3): 114-122. https://doi.org/10.3923/AJERPK.2019.114.122
Chicago/Turabian Style
Dereje, Getahun, and Dereje Alemu.
2019. "Response of Maize (Zea maize) to Phosphorus Fertilizer Rates on Nitisols in Assosa Zone of Benishangul Gumuz Region, Western Ethiopia" Asian Journal of Emerging Research 1, no. 3: 114-122. https://doi.org/10.3923/AJERPK.2019.114.122

This work is licensed under a Creative Commons Attribution 4.0 International License.